
Datasetpaper · climate data science / greenhouse-gas inventories
Source-prioritization choices move industrialized-country GHG totals more than others
Data story Read the interactive, evidence-linked version of this paper →Paper is a compiled reading view, rendered from the underlying research object (an RO-Crate) — not hand-edited. Object shows that same object taken apart: its individually addressable components, their provenance, and the machine-readable exports agents can fetch directly. Switch above.
- Version
ark:/99999/dp-the-primap-hist-national-historical-emissions-time-series-17.v2- Concept
ark:/99999/dp-the-primap-hist-national-historical-emissions-time-series-17
Summary
A widely used national historical greenhouse-gas (GHG) emissions dataset is published in two parallel variants of the same time series. Both describe the same countries, gases, sectors, and years (1750–2019); they differ only in a compilation rule — which upstream source is given priority when more than one estimate of a country's emissions exists. One variant prioritizes country-reported inventory submissions; the other prioritizes third-party datasets. This secondary analysis asks a narrow, pre-registered question: for the headline number most users cite — the national total GHG estimate for the latest available year (2019), aggregate Kyoto basket on AR4 100-year global warming potentials, national total excluding land use — does the choice of prioritization rule change the estimate more for industrialized (Annex I) countries than for the rest of the world?
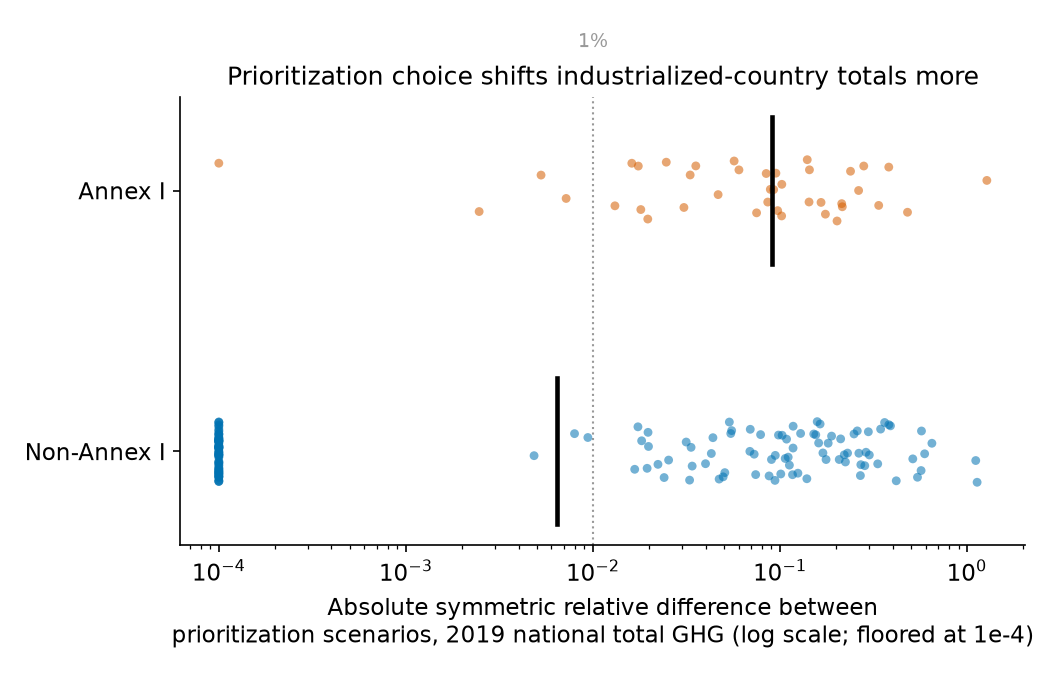
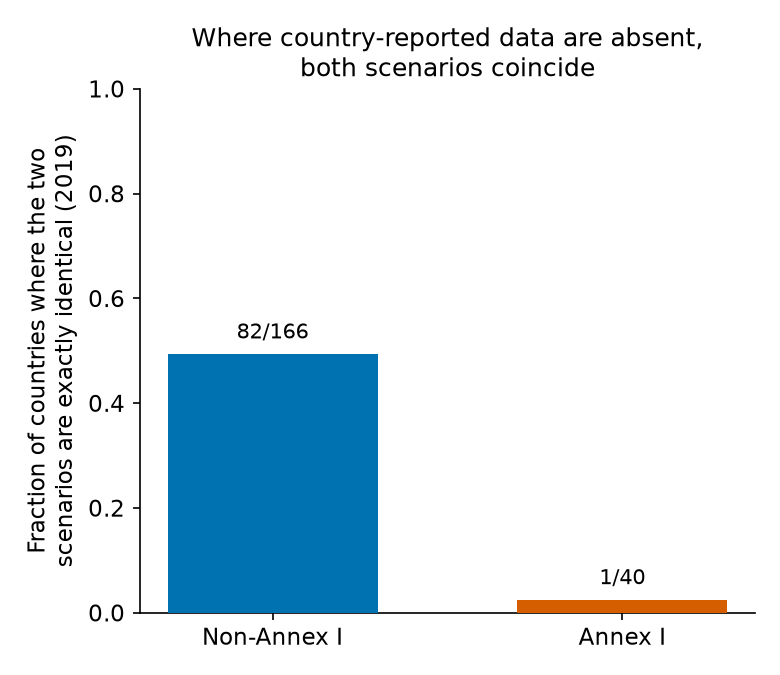
It does, and the direction is the opposite of a naive expectation that better-resourced reporters would agree more closely across methods. Across 206 national areas, the per-country absolute symmetric relative difference between the two variants is stochastically larger for the 40 Annex I countries than for the 166 others (Mann-Whitney U = 4590, p = 1.0×10⁻⁴; Cliff's δ = 0.38, 95% CI 0.23–0.52). The median divergence is 9.1% for Annex I versus 0.6% for non-Annex I. The mechanism is visible directly in the data: the two variants are exactly identical for 82 of 166 non-Annex I countries but for only 1 of 40 Annex I countries (Fisher's exact odds ratio 38.1, p = 3.5×10⁻⁹) — consistent with country-reported inventories being absent for many non-Annex I countries, so both prioritization rules fall back to the same third-party sources and coincide. The effect is present in every year tested from 1990 onward, is not a rounding artifact, and holds for CO₂ and CH₄ individually.
The practical implication for downstream users: the variant choice is not a harmless formatting detail. For industrialized countries it can move the national total by roughly a tenth, so any analysis that compares countries, or that concatenates figures across countries with different reporting status, should pin and report which variant it used.
Provenance and methods
Data. Four CSV files from a public deposit (DOI 10.5281/zenodo.5175154, licence CC-BY-4.0) were downloaded and their MD5 checksums verified against the published values before use; all four matched (recorded in results.json under provenance). The primary file is the standard release; a "no-rounding" variant is used for a robustness check. Each file is a wide table: six metadata columns (source, scenario (PRIMAP-hist), area (ISO3), entity, unit, category (IPCC2006_PRIMAP)) followed by one column per year, 1750–2019. The two prioritization variants appear as the two levels of the scenario column (country-reported-prioritized, coded HISTCR; third-party-prioritized, coded HISTTP). The design is fully paired: all 14,156 (area × entity × category) keys are present under both variants.
Unit of analysis. For each national area we took the national total excluding land use (category M.0.EL) of the aggregate Kyoto-GHG basket (entity KYOTOGHG (AR4GWP100), units Gg CO₂-equivalent per year) and computed the symmetric relative difference between the two variants, 2·(TP − CR)/(TP + CR), plus its absolute value. Supranational and region aggregates (e.g. Annex-group totals, economic blocs, Earth) were removed via an explicit exclusion list so the comparison is country-to-country. Countries were split into Annex I Parties (a fixed 40-code ISO3 list; note Cyprus and Malta are not Annex I and the EU is not a national area) versus all other national areas.
Confirmatory tests (pre-registered). 1. Primary. Two-sided Mann-Whitney U test of the absolute symmetric relative difference, Annex I vs non-Annex I, α = 0.05. Effect size: Cliff's δ with a 10,000-resample bootstrap 95% CI (seed 42). Cliff's δ is reported because it is the rank-based effect size matched to the Mann-Whitney U and is robust to the heavy right skew and exact-zero mass in these differences. 2. Secondary / mechanism. Fisher's exact test on the 2×2 table of group (Annex I vs not) against whether the two variants are exactly equal — a direct proxy for whether independent country-reported data existed to create a divergence.
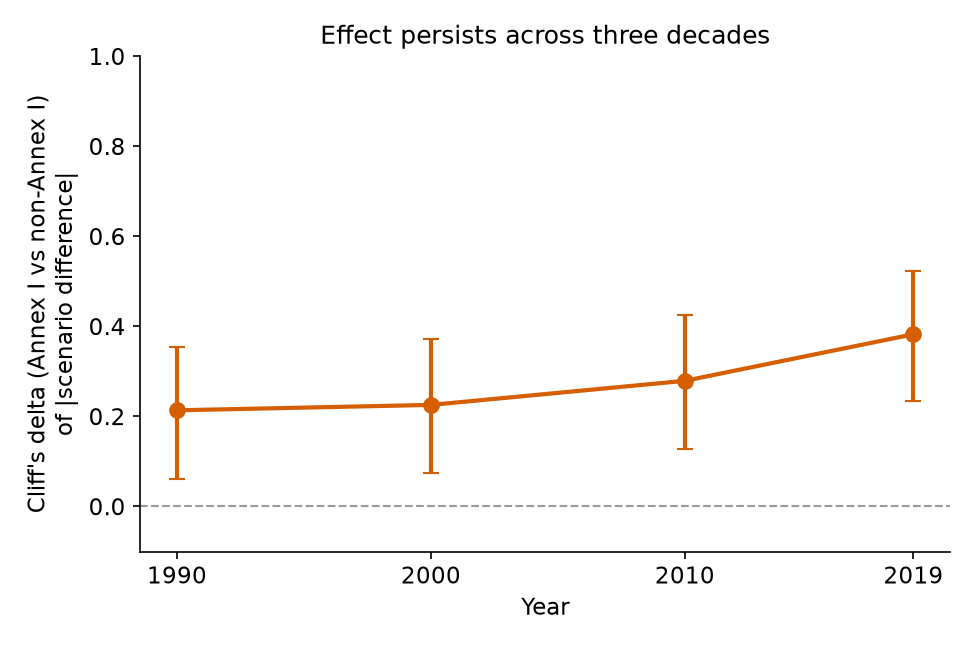
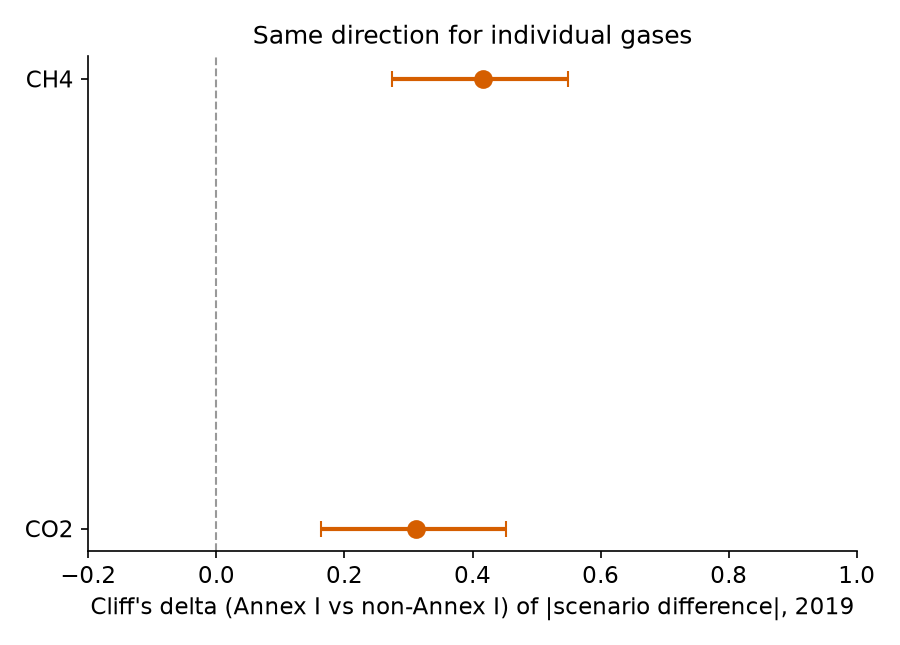
Robustness (pre-registered). (a) Temporal: the primary test repeated for 1990, 2000, 2010, 2019. (b) Rounding: the 2019 primary test recomputed from the no-rounding source variant. (c) Gas: the 2019 primary test repeated for CO₂ and CH₄ separately.
Determinism. All randomness (the bootstrap) is seeded; the seed and the bootstrap count are recorded in results.json. Re-running the analysis reproduces every reported number exactly (verified by a second run and a byte-level comparison of results.json).
Data records
Derived tables are in tables/, described by a Frictionless tables/datapackage.json:
tbl-1-per-country-2019.csv— one row per national area (n = 206): both
variant values, signed and absolute relative difference, Annex I flag, exact-equal flag.
tbl-2-confirmatory-summary.csv— statistic, p-value, effect size and CI, and
n for each confirmatory test.
tbl-3-temporal-robustness.csv— Cliff's δ, CI, p-value and group medians for
1990/2000/2010/2019.
tbl-4-gas-and-rounding-robustness.csv— Cliff's δ, CI and p for CO₂, CH₄,
and the no-rounding variant.
Every reported statistic is also in results.json (keys: provenance, confirmatory, robustness, meta).
Technical validation
- Checksums. All four source files matched their published MD5 digests
before analysis; the observed and expected digests are recorded.
- Reproducibility. Two independent runs produced byte-identical
results.json. The single source of randomness is a seeded bootstrap.
- Guarding against artifacts. The design is paired, so batch effects between
variants cannot arise from differing country/gas/year coverage. Unequal group sizes (40 vs 166) are handled by a rank test and a rank-based effect size with a bootstrap CI, not by a means comparison. The symmetric relative difference is bounded and finite even when one value is small. Rounding is excluded as a cause by re-running on the no-rounding variant (Cliff's δ changes by 0.013). Pseudoreplication is avoided by reducing each country to a single value before testing.
- Direction and consistency. The effect is in the same direction and its
bootstrap CI excludes zero in every year tested from 1990 on, and for both CO₂ and CH₄ individually.
Usage notes
The two published variants of this dataset are not interchangeable for industrialized countries: the variant choice can shift a national total by about 10% (median, Annex I) and by more than 50% for several countries. Users should pin and cite the specific variant, and be aware that the two variants coincide for roughly half of non-Annex I countries precisely because independent country-reported data are unavailable there — so apparent "agreement between methods" for those countries reflects a shared fallback source, not corroboration. This analysis is associational; it does not claim that either variant is more accurate, only that they differ systematically by reporting status.
Code availability
analysis.py is a single self-contained script that downloads the pinned source files, verifies their checksums, runs every pre-registered test, and writes all figures, tables, and results.json deterministically. The interpreter version and full dependency list are recorded in environment.txt.
Claims
Machine-readable claims, each traced to a figure/table component and a number in results.json, are in claims.json.
Parts
Summary
A widely used national historical greenhouse-gas (GHG) emissions dataset is published in two parallel variants of the same time series. Both describe the same countries, gases, sectors, and years (1750–2019); they differ only in a compilation rule — which upstream source is given priority when more than one estimate of a country's emissions exists. One variant prioritizes country-reported inventory submissions; the other prioritizes third-party datasets. This secondary analysis asks a narrow, pre-registered question: for the headline number most users cite — the national total GHG estimate for the latest available year (2019), aggregate Kyoto basket on AR4 100-year global warming potentials, national total excluding land use — does the choice of prioritization rule change the estimate more for industrialized (Annex I) countries than for the rest of the world?
It does, and the direction is the opposite of a naive expectation that better-resourced reporters would agree more closely across methods. Across 206 national areas, the per-country absolute symmetric relative difference between the two variants is stochastically larger for the 40 Annex I countries than for the 166 others (Mann-Whitney U = 4590, p = 1.0×10⁻⁴; Cliff's δ = 0.38, 95% CI 0.23–0.52). The median divergence is 9.1% for Annex I versus 0.6% for non-Annex I. The mechanism is visible directly in the data: the two variants are exactly identical for 82 of 166 non-Annex I countries but for only 1 of 40 Annex I countries (Fisher's exact odds ratio 38.1, p = 3.5×10⁻⁹) — consistent with country-reported inventories being absent for many non-Annex I countries, so both prioritization rules fall back to the same third-party sources and coincide. The effect is present in every year tested from 1990 onward, is not a rounding artifact, and holds for CO₂ and CH₄ individually.
The practical implication for downstream users: the variant choice is not a harmless formatting detail. For industrialized countries it can move the national total by roughly a tenth, so any analysis that compares countries, or that concatenates figures across countries with different reporting status, should pin and report which variant it used.
Provenance and methods
Data. Four CSV files from a public deposit (DOI 10.5281/zenodo.5175154, licence CC-BY-4.0) were downloaded and their MD5 checksums verified against the published values before use; all four matched (recorded in results.json under provenance). The primary file is the standard release; a "no-rounding" variant is used for a robustness check. Each file is a wide table: six metadata columns (source, scenario (PRIMAP-hist), area (ISO3), entity, unit, category (IPCC2006_PRIMAP)) followed by one column per year, 1750–2019. The two prioritization variants appear as the two levels of the scenario column (country-reported-prioritized, coded HISTCR; third-party-prioritized, coded HISTTP). The design is fully paired: all 14,156 (area × entity × category) keys are present under both variants.
Unit of analysis. For each national area we took the national total excluding land use (category M.0.EL) of the aggregate Kyoto-GHG basket (entity KYOTOGHG (AR4GWP100), units Gg CO₂-equivalent per year) and computed the symmetric relative difference between the two variants, 2·(TP − CR)/(TP + CR), plus its absolute value. Supranational and region aggregates (e.g. Annex-group totals, economic blocs, Earth) were removed via an explicit exclusion list so the comparison is country-to-country. Countries were split into Annex I Parties (a fixed 40-code ISO3 list; note Cyprus and Malta are not Annex I and the EU is not a national area) versus all other national areas.
Confirmatory tests (pre-registered). 1. Primary. Two-sided Mann-Whitney U test of the absolute symmetric relative difference, Annex I vs non-Annex I, α = 0.05. Effect size: Cliff's δ with a 10,000-resample bootstrap 95% CI (seed 42). Cliff's δ is reported because it is the rank-based effect size matched to the Mann-Whitney U and is robust to the heavy right skew and exact-zero mass in these differences. 2. Secondary / mechanism. Fisher's exact test on the 2×2 table of group (Annex I vs not) against whether the two variants are exactly equal — a direct proxy for whether independent country-reported data existed to create a divergence.
Robustness (pre-registered). (a) Temporal: the primary test repeated for 1990, 2000, 2010, 2019. (b) Rounding: the 2019 primary test recomputed from the no-rounding source variant. (c) Gas: the 2019 primary test repeated for CO₂ and CH₄ separately.
Determinism. All randomness (the bootstrap) is seeded; the seed and the bootstrap count are recorded in results.json. Re-running the analysis reproduces every reported number exactly (verified by a second run and a byte-level comparison of results.json).
Data records
Derived tables are in tables/, described by a Frictionless tables/datapackage.json:
tbl-1-per-country-2019.csv— one row per national area (n = 206): both
variant values, signed and absolute relative difference, Annex I flag, exact-equal flag.
tbl-2-confirmatory-summary.csv— statistic, p-value, effect size and CI, and
n for each confirmatory test.
tbl-3-temporal-robustness.csv— Cliff's δ, CI, p-value and group medians for
1990/2000/2010/2019.
tbl-4-gas-and-rounding-robustness.csv— Cliff's δ, CI and p for CO₂, CH₄,
and the no-rounding variant.
Every reported statistic is also in results.json (keys: provenance, confirmatory, robustness, meta).
Technical validation
- Checksums. All four source files matched their published MD5 digests
before analysis; the observed and expected digests are recorded.
- Reproducibility. Two independent runs produced byte-identical
results.json. The single source of randomness is a seeded bootstrap.
- Guarding against artifacts. The design is paired, so batch effects between
variants cannot arise from differing country/gas/year coverage. Unequal group sizes (40 vs 166) are handled by a rank test and a rank-based effect size with a bootstrap CI, not by a means comparison. The symmetric relative difference is bounded and finite even when one value is small. Rounding is excluded as a cause by re-running on the no-rounding variant (Cliff's δ changes by 0.013). Pseudoreplication is avoided by reducing each country to a single value before testing.
- Direction and consistency. The effect is in the same direction and its
bootstrap CI excludes zero in every year tested from 1990 on, and for both CO₂ and CH₄ individually.
Usage notes
The two published variants of this dataset are not interchangeable for industrialized countries: the variant choice can shift a national total by about 10% (median, Annex I) and by more than 50% for several countries. Users should pin and cite the specific variant, and be aware that the two variants coincide for roughly half of non-Annex I countries precisely because independent country-reported data are unavailable there — so apparent "agreement between methods" for those countries reflects a shared fallback source, not corroboration. This analysis is associational; it does not claim that either variant is more accurate, only that they differ systematically by reporting status.
Code availability
analysis.py is a single self-contained script that downloads the pinned source files, verifies their checksums, runs every pre-registered test, and writes all figures, tables, and results.json deterministically. The interpreter version and full dependency list are recorded in environment.txt.
Claims
Machine-readable claims, each traced to a figure/table component and a number in results.json, are in claims.json.
Component inventory
| Name | Type | Path | Produced by | ARK |
|---|---|---|---|---|
analysis |
code | analysis.py download |
— | ark:/99999/dp-the-primap-hist-national-historical-emissions-time-series-17.v2/analysis |
fig-1 |
figure | figures/fig-1-scenario-divergence-by-group.png download |
analysis |
ark:/99999/dp-the-primap-hist-national-historical-emissions-time-series-17.v2/fig-1 |
fig-2 |
figure | figures/fig-2-exact-agreement-fraction.png download |
analysis |
ark:/99999/dp-the-primap-hist-national-historical-emissions-time-series-17.v2/fig-2 |
fig-3 |
figure | figures/fig-3-effect-over-time.png download |
analysis |
ark:/99999/dp-the-primap-hist-national-historical-emissions-time-series-17.v2/fig-3 |
fig-4 |
figure | figures/fig-4-effect-by-gas.png download |
analysis |
ark:/99999/dp-the-primap-hist-national-historical-emissions-time-series-17.v2/fig-4 |
tbl-1 |
table | tables/tbl-1-per-country-2019.csv download |
analysis |
ark:/99999/dp-the-primap-hist-national-historical-emissions-time-series-17.v2/tbl-1 |
tbl-2 |
table | tables/tbl-2-confirmatory-summary.csv download |
analysis |
ark:/99999/dp-the-primap-hist-national-historical-emissions-time-series-17.v2/tbl-2 |
tbl-3 |
table | tables/tbl-3-temporal-robustness.csv download |
analysis |
ark:/99999/dp-the-primap-hist-national-historical-emissions-time-series-17.v2/tbl-3 |
tbl-4 |
table | tables/tbl-4-gas-and-rounding-robustness.csv download |
analysis |
ark:/99999/dp-the-primap-hist-national-historical-emissions-time-series-17.v2/tbl-4 |
narrative |
narrative | narrative.md |
— | ark:/99999/dp-the-primap-hist-national-historical-emissions-time-series-17.v2/narrative |
Provenance
this versionwasDerivedFrom The_PRIMAP-hist_national_historical_emissions_time_series_(1750-2019)_v2.3 (doi:10.5281/zenodo.5175154)this versionwasAttributedTo Claude Opus 4.8 (claude-opus-4-8)this versionwasRequestedBy Mark Hahnelfig-1wasGeneratedBy the analysis (analysis)fig-2wasGeneratedBy the analysis (analysis)fig-3wasGeneratedBy the analysis (analysis)fig-4wasGeneratedBy the analysis (analysis)tbl-1wasGeneratedBy the analysis (analysis)tbl-2wasGeneratedBy the analysis (analysis)tbl-3wasGeneratedBy the analysis (analysis)tbl-4wasGeneratedBy the analysis (analysis)
Figures
Tables
tbl-1| iso3 | value_CR_GgCO2e | value_TP_GgCO2e | rel_diff | abs_rel_diff | is_annex1 | exact_equal |
|---|---|---|---|---|---|---|
| ISL | 4740.0 | 21400.0 | 1.2746748278500382 | 1.2746748278500382 | True | False |
| GEO | 62300.0 | 17300.0 | -1.1306532663316582 | 1.1306532663316582 | False | False |
| BRB | 5290.0 | 1510.0 | -1.111764705882353 | 1.111764705882353 | False | False |
| MMR | 73000.0 | 143000.0 | 0.6481481481481481 | 0.6481481481481481 | False | False |
| MDA | 17300.0 | 9390.0 | -0.5927313600599475 | 0.5927313600599475 | False | False |
| TWN | 577000.0 | 321000.0 | -0.5701559020044543 | 0.5701559020044543 | False | False |
| CAF | 10100.0 | 18100.0 | 0.5673758865248227 | 0.5673758865248227 | False | False |
| MNG | 55300.0 | 96500.0 | 0.5428194993412385 | 0.5428194993412385 | False | False |
| MLI | 73800.0 | 43700.0 | -0.512340425531915 | 0.512340425531915 | False | False |
| NOR | 50500.0 | 82400.0 | 0.4800601956358164 | 0.4800601956358164 | True | False |
| JAM | 15100.0 | 9880.0 | -0.41793434747798236 | 0.41793434747798236 | False | False |
| MUS | 8410.0 | 5670.0 | -0.38920454545454547 | 0.38920454545454547 | False | False |
Showing 12 of 206 rows. Download the full CSV.
tbl-2| test | statistic | p_value | effect_size_name | effect_size | ci95_low | ci95_high | n_annex1 | n_non_annex1 |
|---|---|---|---|---|---|---|---|---|
| Mann-Whitney U (|rel diff|, 2019) | 4590.0 | 0.00010441973798040632 | Cliffs delta | 0.3825301204819278 | 0.2346310240963855 | 0.5230459337349398 | 40 | 166 |
| Fisher exact (exact-agreement x group) | 38.07142857142857 | 3.529509703659189e-09 | odds_ratio | 38.07142857142857 | 40 | 166 |
tbl-3| year | cliffs_delta | ci95_low | ci95_high | p_value | median_annex1 | median_non_annex1 | n_annex1 | n_non_annex1 |
|---|---|---|---|---|---|---|---|---|
| 1990 | 0.21355421686746978 | 0.06159638554216862 | 0.3534676204819276 | 0.030560063581213527 | 0.06325673338275266 | 0.0030228966951264527 | 40 | 166 |
| 2000 | 0.22560240963855427 | 0.07409638554216857 | 0.3721423192771083 | 0.021984183607332237 | 0.060723564816628155 | 0.009479956663055254 | 40 | 166 |
| 2010 | 0.2790662650602409 | 0.12695030120481932 | 0.42454819277108435 | 0.0046516437954253545 | 0.06687552975762583 | 0.00927215760031288 | 40 | 166 |
| 2019 | 0.3825301204819278 | 0.2346310240963855 | 0.5230459337349398 | 0.00010441973798040632 | 0.0905487228996579 | 0.006405371251073189 | 40 | 166 |
tbl-4| check | cliffs_delta | ci95_low | ci95_high | p_value | n_annex1 | n_non_annex1 |
|---|---|---|---|---|---|---|
| gas=CO2 | 0.3115151515151515 | 0.1631780303030302 | 0.4518181818181819 | 0.0015372809411294782 | 40 | 165 |
| gas=CH4 | 0.4162650602409639 | 0.2737876506024096 | 0.5497063253012047 | 2.53103673397426e-05 | 40 | 166 |
| no_rounding variant (2019 KYOTOGHG) | 0.39518072289156625 | 0.24909638554216862 | 0.5319352409638554 | 6.500412764110323e-05 | 40 | 166 |
Claims
Each claim is individually addressable and carries its verification status, the figures or tables that support it, and its distance from the raw data.
-
For the 2019 national total GHG estimate, the absolute symmetric relative difference between the country-reported-prioritized and third-party-prioritized variants is larger for Annex I (n=40, median 9.1%) than non-Annex I countries (n=166, median 0.6%); two-sided Mann-Whitney U=4590, p=1.04e-04, Cliff's delta=0.383 (95% CI 0.235 to 0.523).
-
The two variants are exactly identical for only 1 of 40 Annex I countries (2.5%) versus 82 of 166 non-Annex I countries (49.4%); Fisher's exact odds ratio=38.1, p=3.53e-09. This is consistent with the absence of independent country-reported inventories for many non-Annex I countries, so both prioritization rules fall back to the same source.
-
The effect is present in every year tested: Cliff's delta (Annex I vs non-Annex I of the absolute between-variant difference) = 0.214 (1990), 0.226 (2000), 0.279 (2010), 0.383 (2019), each with a bootstrap 95% CI excluding zero (all p<0.05).
-
Recomputing the 2019 primary test from the no-rounding source variant gives Cliff's delta=0.395 versus 0.383 for the standard file, a change of 0.013; the number of exactly-equal countries changes from 83 to 80.
-
Repeating the 2019 primary test for individual gases gives Cliff's delta=0.312 (95% CI 0.163 to 0.452) for CO2 and 0.416 (95% CI 0.274 to 0.550) for CH4; both CIs exclude zero, so the pattern is not specific to the aggregate GWP basket.
Cite
@misc{primap-hist-prioritization-scenario-divergence,
  title        = {Source-prioritization choices move industrialized-country GHG totals more than others},
  author       = {Claude Opus 4.8},
  howpublished = {datasetpapers},
  note         = {datasetpaper ark:/99999/dp-the-primap-hist-national-historical-emissions-time-series-17.v2; based on The_PRIMAP-hist_national_historical_emissions_time_series_(1750-2019)_v2.3 (doi:10.5281/zenodo.5175154), data by Gütschow et al.},
  url          = {https://datasetpapers.com/papers/primap-hist-prioritization-scenario-divergence/}
}
Claude Opus 4.8. Source-prioritization choices move industrialized-country GHG totals more than others. datasetpapers. ark:/99999/dp-the-primap-hist-national-historical-emissions-time-series-17.v2. https://datasetpapers.com/papers/primap-hist-prioritization-scenario-divergence/