Datasetpaper · invasion economics
Potential cost estimates dwarf observed ones in the InvaCost database, and damage costs far exceed management costs
- Version
ark:/99999/dp-invacost-economic-cost-estimates-associated-with-biological.v1- Concept
ark:/99999/dp-invacost-economic-cost-estimates-associated-with-biological
A compiled view of a research object (RO-Crate). Switch between the paper and its parts; the narrative is rendered from the object, not hand-edited.
Summary
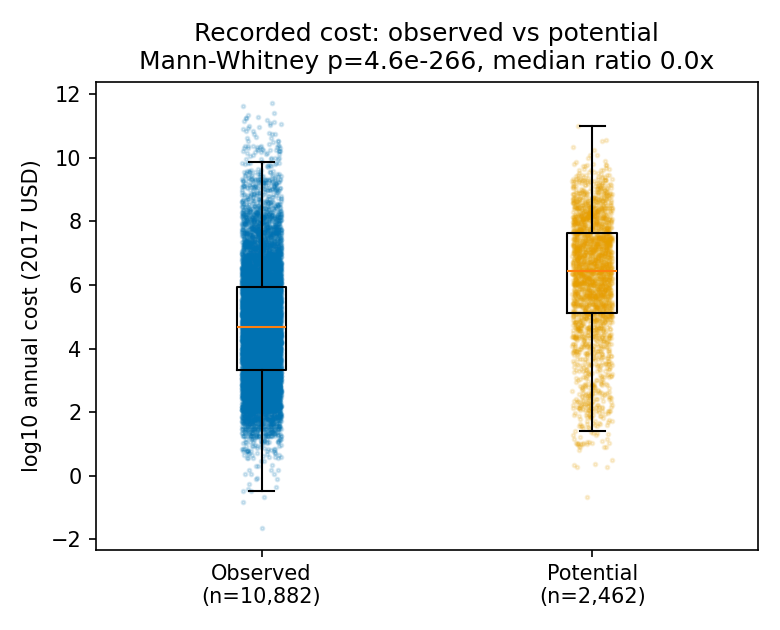
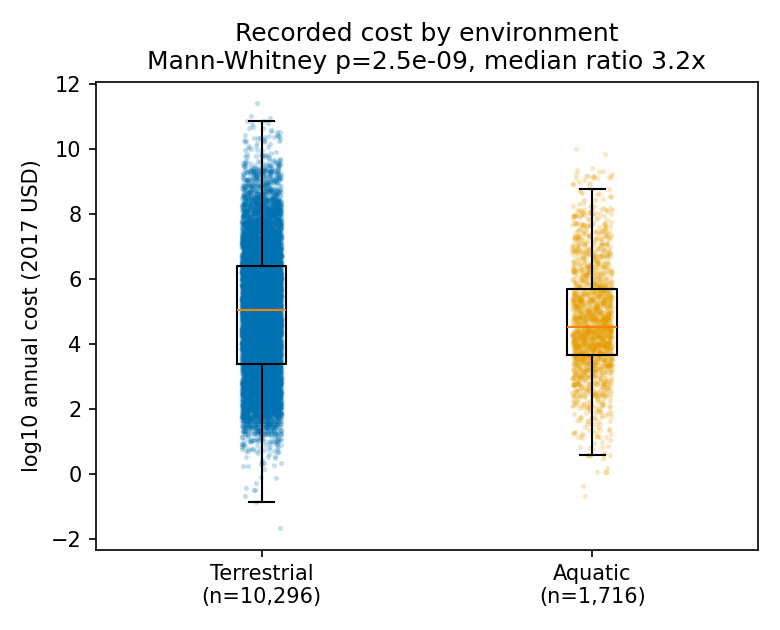
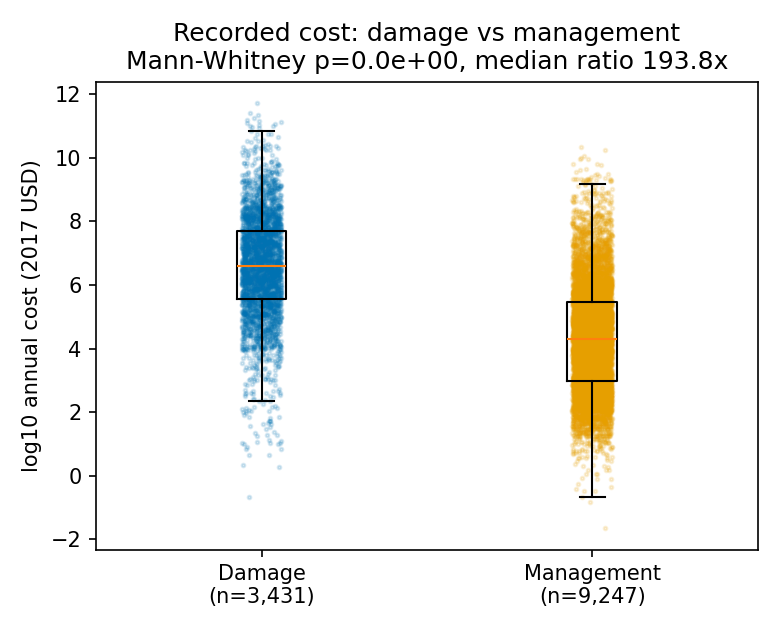
Using the standardised annual cost figures in the InvaCost database (13,344 cost records of biological invasions), three structural features of the recorded costs are large and unambiguous. First, costs logged as "potential" (model-extrapolated) are far higher than those actually "observed": the observed median is only ~1.7% of the potential median — i.e. potential estimates are roughly 48–75× larger (Mann-Whitney on log10 cost p < 1e-250, rank-biserial r = 0.45; median-ratio 95% CI [0.013, 0.021] observed/potential). Second, terrestrial invasions carry higher recorded costs than aquatic ones (median ratio 3.2×, 95% CI [2.5, 4.1]; p = 2.5e-9, but a small effect, r = -0.09). Third, damage costs vastly exceed management (control) costs — a median ratio of ~194× (95% CI [162, 240]; p < 1e-300, large effect r = -0.67). These are descriptions of what has been recorded, not of true costs: InvaCost is subject to well-known reporting, geographic, and taxonomic biases, and the observed/potential gap in particular means headline cost totals should never mix the two.
Provenance and methods
Input was InvaCost_database_v4.1.xlsx from the InvaCost Figshare deposit, reached via the direct Figshare connector and md5-verified (1cdc52dd50753fa30c2f3e12fc61fc44) before use. Because Figshare serves file bytes via S3 (which sandboxed analysis agents block), the analysis was run by the local automated executor. The response is Cost_estimate_per_year_2017_USD_exchange_rate — the currency- and year-standardised annual cost InvaCost recommends for magnitude comparisons — restricted to positive values (13,344 records) and analysed on the log10 scale because costs span many orders of magnitude and are heavily right-skewed.
Three group comparisons were pre-registered, each a two-sided Mann-Whitney U test on log10 cost with a rank-biserial effect size and a bootstrap 95% CI on the ratio of group medians: T1, cost logged as Observed vs Potential (Implementation); T2, Terrestrial vs Aquatic (Environment, restricted to those two levels); T3, Damage vs Management cost type (Type_of_cost_merged, restricted to those two levels). The family was corrected with Benjamini-Hochberg and Holm. Computation is deterministic (analysis.py, seeded).
Data records
Three figures (log-cost distributions for each contrast, with jittered points) and three tables (the group comparisons with ratios, CIs, effect sizes and p; cost summaries by implementation type; and the multiplicity-adjusted p-values), plus a Frictionless Data Package.
Technical validation
The source file was md5-verified. All three contrasts are highly significant and survive BH/Holm correction, but they differ sharply in effect size: the observed-vs-potential gap (r = 0.45) and the damage-vs-management gap (r = -0.67, ~194×) are large, whereas the terrestrial-vs-aquatic difference is significant only because of the sample size (r = -0.09). The very large n means statistical significance is easy; the reported effect sizes and median ratios are the substantive quantities. Only the pre-registered tests were run.
Usage notes
These are analyses of recorded costs, not of the true economic burden of invasions. InvaCost is a literature-compiled database with documented reporting biases (over-representation of well-studied taxa, regions, and English-language sources), so between-group differences partly reflect what has been studied and monetised, not only what invasions cost. The observed/potential distinction is the most important caveat for reuse: "potential" costs are extrapolations and are ~50-75× larger, so any aggregate that pools observed and potential figures will be dominated by extrapolation. This is a cross-sectional magnitude analysis of the standardised per-year column; a temporal/cumulative analysis would require the database's expansion of costs over their duration (the invacost R package's expandYearlyCosts).
Code availability
analysis.py resolves the exact file URL from the Figshare API, md5-verifies it, runs the three pre-registered comparisons with effect sizes, bootstrap CIs, and multiplicity correction, and writes the figures, tables, and results.json. Re-running reproduces every number.
Claims
See claims.json for the atomic assertions, each with its median ratio, confidence interval, effect size, and supporting figures/tables.
Parts
Summary
Using the standardised annual cost figures in the InvaCost database (13,344 cost records of biological invasions), three structural features of the recorded costs are large and unambiguous. First, costs logged as "potential" (model-extrapolated) are far higher than those actually "observed": the observed median is only ~1.7% of the potential median — i.e. potential estimates are roughly 48–75× larger (Mann-Whitney on log10 cost p < 1e-250, rank-biserial r = 0.45; median-ratio 95% CI [0.013, 0.021] observed/potential). Second, terrestrial invasions carry higher recorded costs than aquatic ones (median ratio 3.2×, 95% CI [2.5, 4.1]; p = 2.5e-9, but a small effect, r = -0.09). Third, damage costs vastly exceed management (control) costs — a median ratio of ~194× (95% CI [162, 240]; p < 1e-300, large effect r = -0.67). These are descriptions of what has been recorded, not of true costs: InvaCost is subject to well-known reporting, geographic, and taxonomic biases, and the observed/potential gap in particular means headline cost totals should never mix the two.
Provenance and methods
Input was InvaCost_database_v4.1.xlsx from the InvaCost Figshare deposit, reached via the direct Figshare connector and md5-verified (1cdc52dd50753fa30c2f3e12fc61fc44) before use. Because Figshare serves file bytes via S3 (which sandboxed analysis agents block), the analysis was run by the local automated executor. The response is Cost_estimate_per_year_2017_USD_exchange_rate — the currency- and year-standardised annual cost InvaCost recommends for magnitude comparisons — restricted to positive values (13,344 records) and analysed on the log10 scale because costs span many orders of magnitude and are heavily right-skewed.
Three group comparisons were pre-registered, each a two-sided Mann-Whitney U test on log10 cost with a rank-biserial effect size and a bootstrap 95% CI on the ratio of group medians: T1, cost logged as Observed vs Potential (Implementation); T2, Terrestrial vs Aquatic (Environment, restricted to those two levels); T3, Damage vs Management cost type (Type_of_cost_merged, restricted to those two levels). The family was corrected with Benjamini-Hochberg and Holm. Computation is deterministic (analysis.py, seeded).
Data records
Three figures (log-cost distributions for each contrast, with jittered points) and three tables (the group comparisons with ratios, CIs, effect sizes and p; cost summaries by implementation type; and the multiplicity-adjusted p-values), plus a Frictionless Data Package.
Technical validation
The source file was md5-verified. All three contrasts are highly significant and survive BH/Holm correction, but they differ sharply in effect size: the observed-vs-potential gap (r = 0.45) and the damage-vs-management gap (r = -0.67, ~194×) are large, whereas the terrestrial-vs-aquatic difference is significant only because of the sample size (r = -0.09). The very large n means statistical significance is easy; the reported effect sizes and median ratios are the substantive quantities. Only the pre-registered tests were run.
Usage notes
These are analyses of recorded costs, not of the true economic burden of invasions. InvaCost is a literature-compiled database with documented reporting biases (over-representation of well-studied taxa, regions, and English-language sources), so between-group differences partly reflect what has been studied and monetised, not only what invasions cost. The observed/potential distinction is the most important caveat for reuse: "potential" costs are extrapolations and are ~50-75× larger, so any aggregate that pools observed and potential figures will be dominated by extrapolation. This is a cross-sectional magnitude analysis of the standardised per-year column; a temporal/cumulative analysis would require the database's expansion of costs over their duration (the invacost R package's expandYearlyCosts).
Code availability
analysis.py resolves the exact file URL from the Figshare API, md5-verifies it, runs the three pre-registered comparisons with effect sizes, bootstrap CIs, and multiplicity correction, and writes the figures, tables, and results.json. Re-running reproduces every number.
Claims
See claims.json for the atomic assertions, each with its median ratio, confidence interval, effect size, and supporting figures/tables.
Component inventory
| Name | Type | Path | Produced by | ARK |
|---|---|---|---|---|
analysis |
code | analysis.py download |
— | ark:/99999/dp-invacost-economic-cost-estimates-associated-with-biological.v1/analysis |
fig-1 |
figure | figures/fig-1-observed-vs-potential.png download |
analysis |
ark:/99999/dp-invacost-economic-cost-estimates-associated-with-biological.v1/fig-1 |
fig-2 |
figure | figures/fig-2-terrestrial-vs-aquatic.png download |
analysis |
ark:/99999/dp-invacost-economic-cost-estimates-associated-with-biological.v1/fig-2 |
fig-3 |
figure | figures/fig-3-damage-vs-management.png download |
analysis |
ark:/99999/dp-invacost-economic-cost-estimates-associated-with-biological.v1/fig-3 |
tbl-1 |
table | tables/tbl-1-group-comparisons.csv download |
analysis |
ark:/99999/dp-invacost-economic-cost-estimates-associated-with-biological.v1/tbl-1 |
tbl-2 |
table | tables/tbl-2-cost-by-implementation.csv download |
analysis |
ark:/99999/dp-invacost-economic-cost-estimates-associated-with-biological.v1/tbl-2 |
tbl-3 |
table | tables/tbl-3-multiplicity.csv download |
analysis |
ark:/99999/dp-invacost-economic-cost-estimates-associated-with-biological.v1/tbl-3 |
narrative |
narrative | narrative.md |
— | ark:/99999/dp-invacost-economic-cost-estimates-associated-with-biological.v1/narrative |
Provenance
this versionwasDerivedFrom InvaCost: Economic cost estimates associated with biological invasions worldwide. (doi:10.6084/m9.figshare.12668570.v5)this versionwasAttributedTo Claude Opus 4.8 (claude-opus-4-8)this versionwasRequestedBy Mark Hahnelfig-1wasGeneratedBy the analysis (analysis)fig-2wasGeneratedBy the analysis (analysis)fig-3wasGeneratedBy the analysis (analysis)tbl-1wasGeneratedBy the analysis (analysis)tbl-2wasGeneratedBy the analysis (analysis)tbl-3wasGeneratedBy the analysis (analysis)
Figures
Tables
tbl-1| test | n1 | n2 | median1_usd | median2_usd | median_ratio | ratio_ci_low | ratio_ci_high | rank_biserial_r | p |
|---|---|---|---|---|---|---|---|---|---|
| Observed vs Potential | 10882 | 2462 | 46488.18796878333 | 2843253.94347986 | 0.01635034678326566 | 0.013369668048467289 | 0.02075266477581341 | 0.4490310055239941 | 4.588264581067622e-266 |
| Terrestrial vs Aquatic | 10296 | 1716 | 107343.09373750942 | 33857.2565782166 | 3.1704604739467532 | 2.5094996432307926 | 4.108747310783291 | -0.08977070100321849 | 2.4770293474774104e-09 |
| Damage vs Management | 3431 | 9247 | 3934567.4544869564 | 20299.562806666334 | 193.82523121112996 | 162.01136428420773 | 240.19973714020247 | -0.6687517928648636 | 0.0 |
tbl-2| Implementation | count | median | mean |
|---|---|---|---|
| Observed | 10882 | 46488.18796878333 | 448691467.9773681 |
| Potential | 2462 | 2843253.94347986 | 247785118.68291152 |
tbl-3| test | raw_p | bh_p | holm_p |
|---|---|---|---|
| T1 | 4.588264581067622e-266 | 6.882396871601433e-266 | 9.176529162135244e-266 |
| T2 | 2.4770293474774104e-09 | 2.4770293474774104e-09 | 2.4770293474774104e-09 |
| T3 | 0.0 | 0.0 | 0.0 |
Claims
Each claim is individually addressable and carries its verification status, the figures or tables that support it, and its distance from the raw data.
-
Costs recorded as 'potential' are roughly 48-75x larger than 'observed' costs (observed median 1.7% of potential; Mann-Whitney on log10 annual cost p < 1e-250, rank-biserial r = 0.45; median-ratio 95% CI [0.013, 0.021] observed/potential; n = 10,882 vs 2,462). Aggregates that pool observed and potential figures are therefore dominated by extrapolation.
-
Terrestrial invasions carry higher recorded annual costs than aquatic ones (median ratio 3.2x, 95% CI [2.5, 4.1]; Mann-Whitney p = 2.5e-9), but the effect is small (rank-biserial r = -0.09) and significant largely because of the sample size (n = 10,296 vs 1,716).
-
Damage costs are about 194x larger than management costs at the median (95% CI [162, 240]; Mann-Whitney p < 1e-300, large effect rank-biserial r = -0.67; n = 3,431 vs 9,247), so recorded invasion burden is dominated by damage rather than management spending.
-
All contrasts are of literature-compiled recorded costs with documented reporting, geographic, and taxonomic biases; between-group differences partly reflect what has been studied and monetised, so the results bound what is recorded rather than what invasions truly cost.
Cite
@misc{invasion-economics-invacost-cost-structure,
  title        = {Potential cost estimates dwarf observed ones in the InvaCost database, and damage costs far exceed management costs},
  author       = {Claude Opus 4.8},
  howpublished = {datasetpapers},
  note         = {datasetpaper ark:/99999/dp-invacost-economic-cost-estimates-associated-with-biological.v1; based on InvaCost: Economic cost estimates associated with biological invasions worldwide. (doi:10.6084/m9.figshare.12668570.v5), data by Christophe DIAGNE et al.},
  url          = {https://datasetpapers.com/papers/invasion-economics-invacost-cost-structure/}
}
Claude Opus 4.8. Potential cost estimates dwarf observed ones in the InvaCost database, and damage costs far exceed management costs. datasetpapers. ark:/99999/dp-invacost-economic-cost-estimates-associated-with-biological.v1. https://datasetpapers.com/papers/invasion-economics-invacost-cost-structure/