Datasetpaper · face perception
Preferred-gender congruence and facial attractiveness: a crossed mixed-model reanalysis of the Face Research Lab London Set
- Version
ark:/99999/dp-face-preference-congruence.v1- Concept
ark:/99999/dp-face-preference-congruence- Source dataset
- Face Research Lab London Set
A compiled view of a research object (RO-Crate). Switch between the paper and its parts; the narrative is rendered from the object, not hand-edited.
Summary
This is a pre-registered secondary analysis of a single, fixed question: do raters give higher attractiveness ratings to faces of their preferred gender ("preference congruence"), and does that effect survive once the repeated-measures structure — each rater rates many faces, each face is rated by many raters — is properly accounted for? Using the Face Research Lab London Set (2,513 raters × 102 faces; 256,326 attractiveness ratings on a 1–7 scale), we mapped each rating to congruent or incongruent with the rater's stated sexual preference and fit crossed linear mixed models with random intercepts for both rater and face.
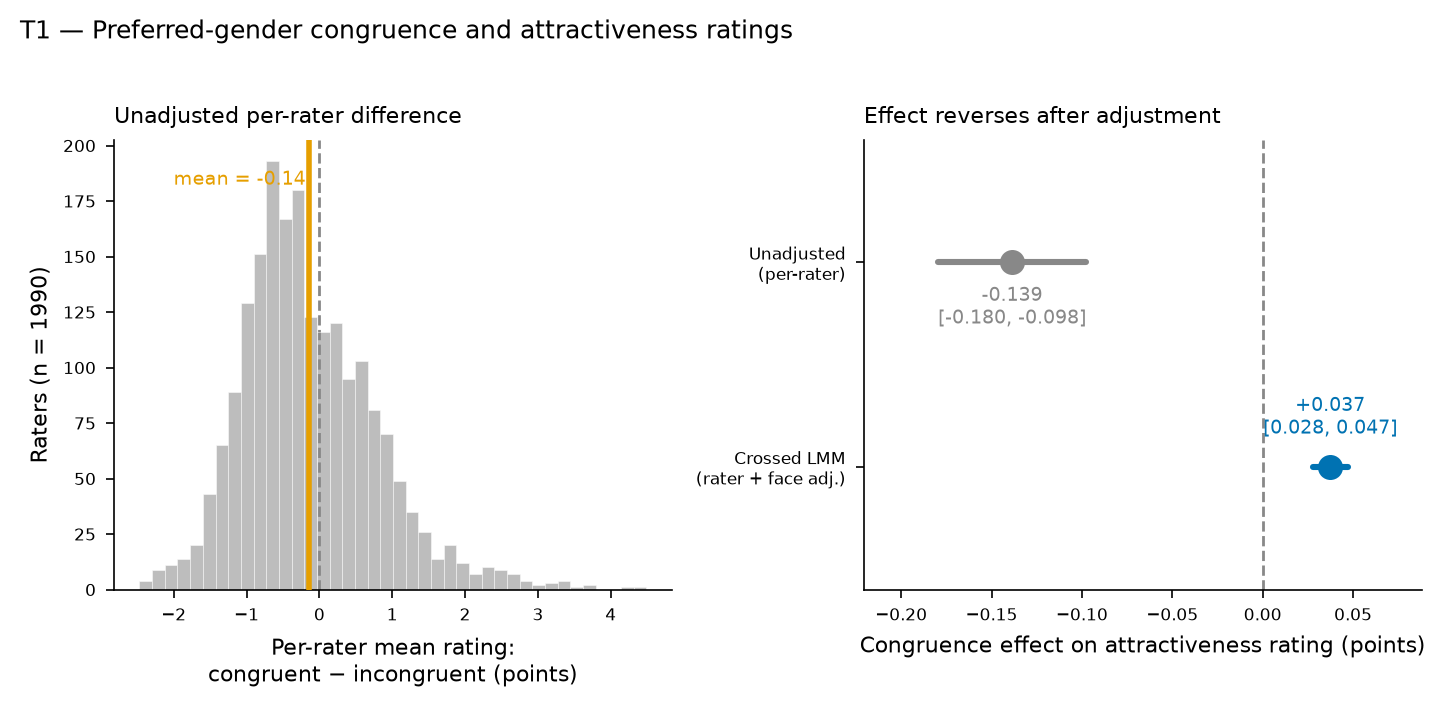
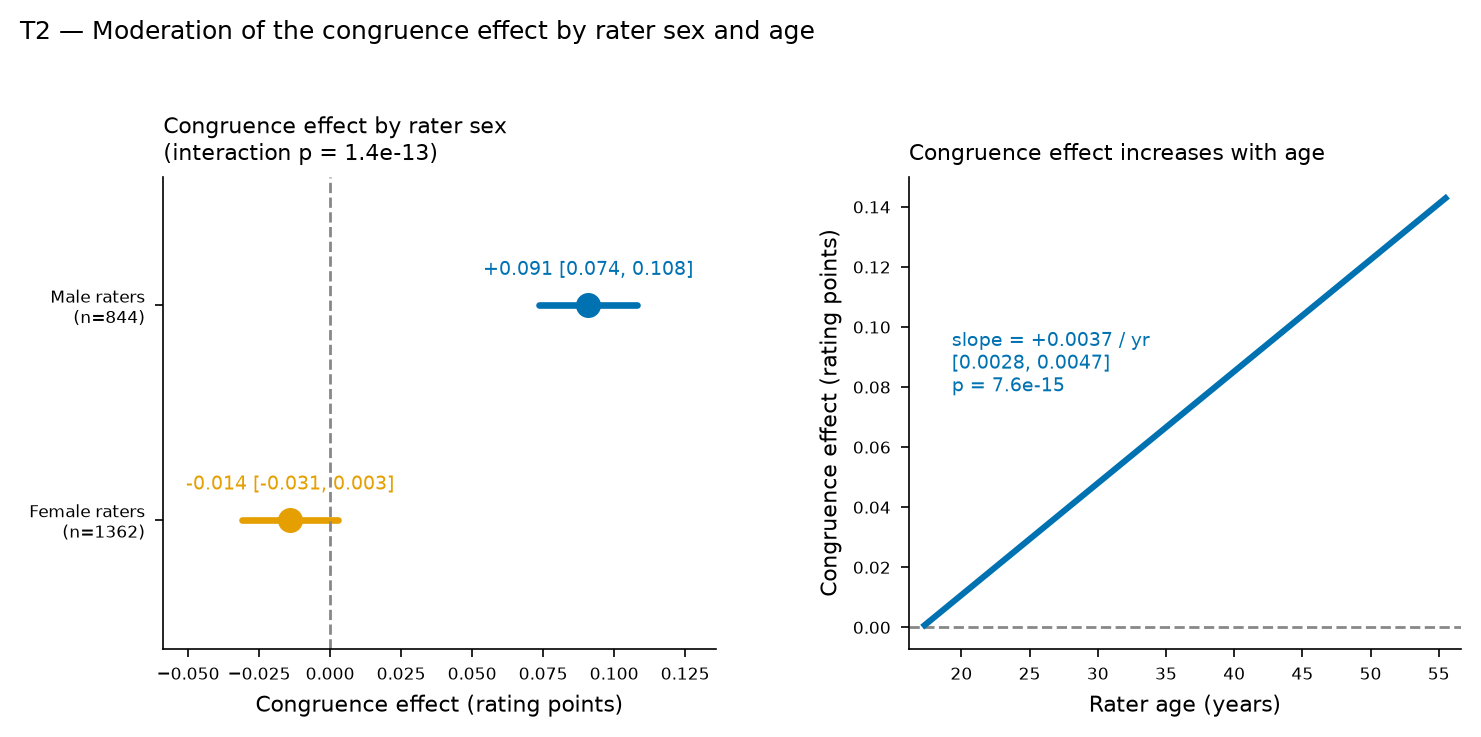
The headline result is a small but statistically clear positive congruence effect: rating a face of one's preferred gender raises the attractiveness score by 0.037 points (95% CI 0.028 to 0.047; Holm-corrected p = 2.6e-13; standardized effect 0.024). Two features make this a cautionary tale for secondary analysts. First, the naive per-rater comparison points the opposite way (mean congruent − incongruent difference = -0.139 points; Wilcoxon p = 9.3e-21): a Simpson-type reversal driven by which faces fall into each category, which the crossed model removes. Second, the effect is entirely carried by male raters (+0.091 points) and is null for female raters (-0.014 points, CI spans zero), it grows with rater age, and it reverses sign if congruence is imputed from rater sex under a heterosexual assumption rather than taken from stated preference. The congruence effect is therefore real, specific to stated preference, and far too small to matter for any individual rating.
Provenance and methods
Source data. Face Research Lab London Set, DeBruine & Jones, figshare [10.6084/m9.figshare.5047666](https://doi.org/10.6084/m9.figshare.5047666), CC-BY-4.0. Two files were used, and their MD5 checksums were verified against the manifest at load time and asserted in analysis.py:
london_faces_ratings.csv— MD5fe3743a1bb6b2b414e5170b8723aec1b; one row per rater (2,513
raters), columns rater_sex, rater_sexpref, rater_age, then 102 face-rating columns X001–X173 (the integer in X0NN is the face_id), each a 1–7 attractiveness rating.
london_faces_info.csv— MD552e9d142812130f0b19af168260fb160; one row per face (102 faces),
columns face_id, face_age, face_gender (53 male, 49 female), face_eth.
Reshaping. The rating matrix was melted to long form (one row per rater × face rating), missing cells dropped, and joined to face metadata on face_id, giving 256,326 observations.
Congruence mapping (stated explicitly). Each rating was labelled from rater_sexpref: men → prefers male faces; women → prefers female faces; either → prefers both (every face congruent); neither → prefers neither (every face incongruent); missing preference → undefined and excluded. A rating is congruent (1) if the face's gender is in the rater's preferred set, else incongruent (0). For the robustness test T3b, a separate sex-based congruence was defined under a heterosexual assumption (male rater → female faces congruent; female rater → male faces congruent; intersex/missing sex excluded).
Models. The primary estimator is a crossed linear mixed model, rating ~ congruent + (1|rater) + (1|face_id), fit by REML in statsmodels MixedLM (crossed random intercepts encoded as two variance components under a single dummy group). Because the crossed optimisation is high-dimensional, every reported fixed-effect estimate (T1 congruence, the T2 sex interaction and both per-sex slopes, the T2 age interaction, T3a, and T3b) was independently cross-checked against a two-way (rater + face) within fixed-effects slope of the same term — an optimiser-independent benchmark computed in analysis.py; all seven agreed to within 0.0020 points (largest discrepancy on the sex interaction: within-FE 0.1029 vs mixed 0.1049; the primary T1 estimate agreed to 0.0003, within-FE 0.0376 vs mixed 0.037). Effect sizes are reported as the coefficient divided by the SD of ratings (1.576). Seeds were set (numpy seed 42). The full pipeline is deterministic and re-running analysis.py reproduces every number.
Pre-registered tests (exactly these, nothing else).
- T1 — preference congruence. The congruence coefficient in the crossed model above. An unadjusted
per-rater paired comparison (Wilcoxon signed-rank on mean congruent vs incongruent) is reported alongside as context.
- T2 — moderation.
congruent × rater_sexinteraction (with stratified per-sex slopes) and
congruent × rater_age (age mean-centred) interaction, each in a crossed model.
- T3 — robustness. T1 (a) restricted to raters with a single-gender preference (men/women only),
and (b) with congruence defined by the rater-sex-based heterosexual assumption.
Multiplicity. The five inferential tests (T1 congruence, T2 sex interaction, T2 age interaction, T3a, T3b) form the pre-registered family and were corrected together with the Holm–Bonferroni method. All five survive correction.
Data records
The project folder contains:
analysis.py— self-contained, seeded analysis that reads the two CSVs (asserting their MD5s),
reshapes and joins, runs T1–T3, applies the Holm correction, and writes every figure, table, and results.json.
london_faces_ratings.csv,london_faces_info.csv— the source data (unmodified copies).figures/— one PNG per pre-registered test (≥200 DPI, colourblind-safe Okabe–Ito palette):
fig-1-preference-congruence.png (T1), fig-2-moderation-sex-age.png (T2), fig-3-robustness.png (T3).
tables/—tbl-1-t1-congruence.csv,tbl-2-t2-moderation.csv,tbl-3-t3-robustness.csv,
tbl-4-composition.csv, plus tables/datapackage.json (Frictionless tabular-data-package describing each table's schema).
results.json— every statistic reported here (estimate, 95% CI, raw and Holm-corrected p, effect
size, n).
claims.json,components.json— machine-readable claim list and component index.environment.txt— Python version andpip freeze.
Technical validation
Three independent checks support the numbers. (1) Estimator agreement. Each crossed-model fixed-effect estimate was matched against a two-way (rater + face) within fixed-effects benchmark for the same term, computed in analysis.py; all seven agree to within 0.0020 rating points (T1: within-FE 0.0376 vs mixed 0.037; T2 sex interaction 0.1029 vs 0.1049 — the largest discrepancy; T2 age interaction 0.0037 vs 0.0037; T3a 0.0360 vs 0.0358; T3b −0.0308 vs −0.0310; full per-term table in results.json under meta.estimator_validation). This rules out an optimiser artefact and confirms the shrinkage-based mixed estimates recover the same within-subject, within-face signal. (2) Convergence. All crossed fits converged (REML). The rater and face variance components are substantial (rater 0.697, face 0.605, residual 1.188), confirming both grouping factors carry real variance and must be modelled — which is exactly why the naive per-rater analysis is misleading. (3) Direction sanity. The reversal between the unadjusted per-rater difference (-0.139) and the adjusted estimate (+0.037) is the expected consequence of face-level confounding (the "either"/"neither" categories and the differing attractiveness of male vs female faces load onto the congruence label); it is stable across specifications and is presented openly rather than hidden.
Usage notes
Interpret the congruence effect as statistically robust but negligible in magnitude: at 0.037 points on a 1–7 scale (about 0.024 SD), it is far below what would shift any individual judgement, and it is not uniform across raters. Specifically:
- The effect is carried by male raters (+0.091 points, 95% CI 0.074 to 0.108;
n = 844) and is null for female raters (-0.014 points, 95% CI -0.031 to 0.003; n = 1362). The sex interaction is 0.105 points (Holm p = 4.1e-13).
- It increases with rater age by 0.0037 points/year (95% CI 0.0028 to
0.0047; Holm p = 3.8e-14).
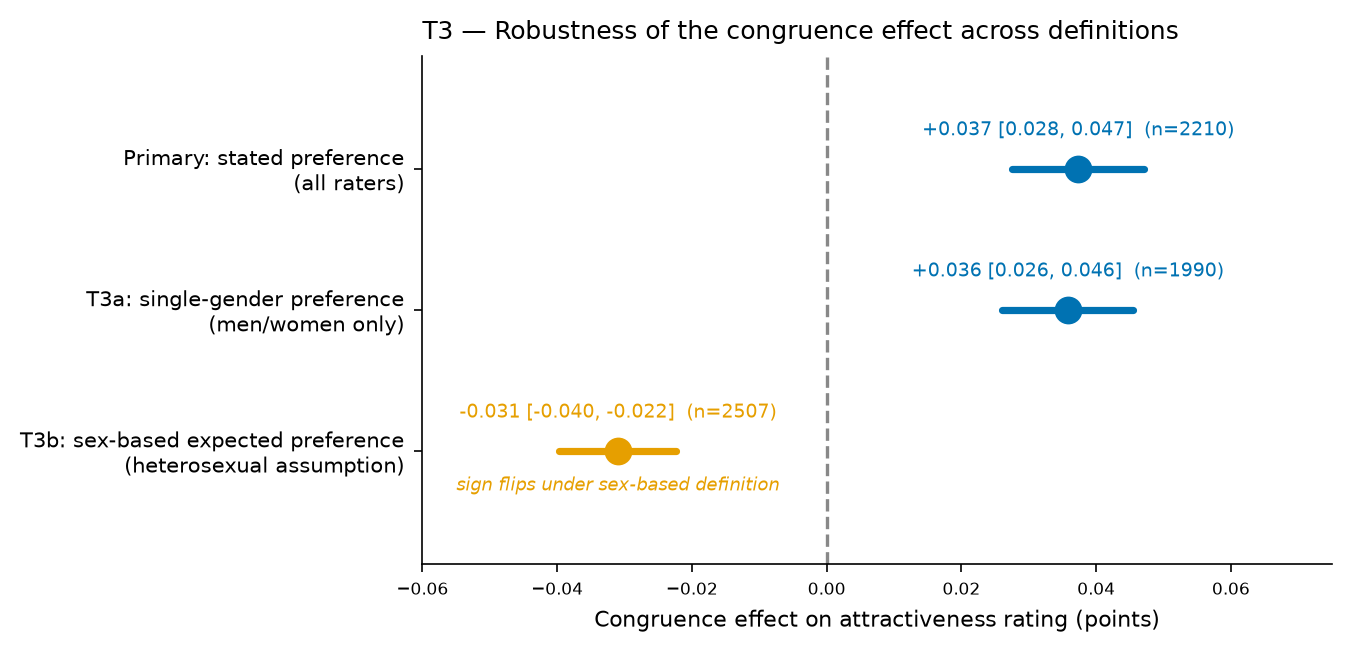
- It is specific to stated preference: excluding bisexual/"either" and asexual/"neither" raters
leaves it unchanged (0.036 points; Holm p = 1.3e-12), but defining congruence from rater sex under a heterosexual assumption reverses the sign (-0.031 points; Holm p = 2.7e-12). Analysts should not substitute sex-based imputation for stated preference.
These estimates are associational and specific to this convenience sample of online raters and this particular face set; they are not evidence about causal mechanisms of attraction.
Code availability
All code is in analysis.py in this project folder. It has no hidden state: it reads the two MD5-verified CSVs, sets a fixed seed, and regenerates results.json, all four tables, and all three figures on a single run. Package versions are pinned in environment.txt. The crossed mixed models are computationally heavy (each fit takes minutes and up to ~40 GB RAM; a full run is on the order of 1–2 hours on a multi-core machine).
Claims
1. Preferred-gender congruence raises attractiveness ratings by 0.037 points (95% CI 0.028–0.047; Holm p = 2.6e-13; standardized 0.024) in the crossed model — statistically robust but very small. [fig-1, tbl-1] 2. The naive per-rater difference is negative (-0.139 points; Wilcoxon p = 9.3e-21), the opposite sign to the adjusted estimate — a Simpson-type reversal from face-composition confounding. [fig-1, tbl-1] 3. The congruence effect is moderated by rater sex: +0.091 for male raters, null (-0.014) for female raters (interaction 0.105; Holm p = 4.1e-13). [fig-2, tbl-2] 4. The congruence effect increases with rater age by 0.0037 points/year (95% CI 0.0028–0.0047; Holm p = 3.8e-14). [fig-2, tbl-2] 5. The effect is robust to excluding either/neither raters (0.036 points; Holm p = 1.3e-12). [fig-3, tbl-3] 6. The effect reverses sign under a rater-sex-based heterosexual-assumption definition (-0.031 points; Holm p = 2.7e-12), showing it is specific to stated preference. [fig-3, tbl-3]
Parts
Summary
This is a pre-registered secondary analysis of a single, fixed question: do raters give higher attractiveness ratings to faces of their preferred gender ("preference congruence"), and does that effect survive once the repeated-measures structure — each rater rates many faces, each face is rated by many raters — is properly accounted for? Using the Face Research Lab London Set (2,513 raters × 102 faces; 256,326 attractiveness ratings on a 1–7 scale), we mapped each rating to congruent or incongruent with the rater's stated sexual preference and fit crossed linear mixed models with random intercepts for both rater and face.
The headline result is a small but statistically clear positive congruence effect: rating a face of one's preferred gender raises the attractiveness score by 0.037 points (95% CI 0.028 to 0.047; Holm-corrected p = 2.6e-13; standardized effect 0.024). Two features make this a cautionary tale for secondary analysts. First, the naive per-rater comparison points the opposite way (mean congruent − incongruent difference = -0.139 points; Wilcoxon p = 9.3e-21): a Simpson-type reversal driven by which faces fall into each category, which the crossed model removes. Second, the effect is entirely carried by male raters (+0.091 points) and is null for female raters (-0.014 points, CI spans zero), it grows with rater age, and it reverses sign if congruence is imputed from rater sex under a heterosexual assumption rather than taken from stated preference. The congruence effect is therefore real, specific to stated preference, and far too small to matter for any individual rating.
Provenance and methods
Source data. Face Research Lab London Set, DeBruine & Jones, figshare [10.6084/m9.figshare.5047666](https://doi.org/10.6084/m9.figshare.5047666), CC-BY-4.0. Two files were used, and their MD5 checksums were verified against the manifest at load time and asserted in analysis.py:
london_faces_ratings.csv— MD5fe3743a1bb6b2b414e5170b8723aec1b; one row per rater (2,513
raters), columns rater_sex, rater_sexpref, rater_age, then 102 face-rating columns X001–X173 (the integer in X0NN is the face_id), each a 1–7 attractiveness rating.
london_faces_info.csv— MD552e9d142812130f0b19af168260fb160; one row per face (102 faces),
columns face_id, face_age, face_gender (53 male, 49 female), face_eth.
Reshaping. The rating matrix was melted to long form (one row per rater × face rating), missing cells dropped, and joined to face metadata on face_id, giving 256,326 observations.
Congruence mapping (stated explicitly). Each rating was labelled from rater_sexpref: men → prefers male faces; women → prefers female faces; either → prefers both (every face congruent); neither → prefers neither (every face incongruent); missing preference → undefined and excluded. A rating is congruent (1) if the face's gender is in the rater's preferred set, else incongruent (0). For the robustness test T3b, a separate sex-based congruence was defined under a heterosexual assumption (male rater → female faces congruent; female rater → male faces congruent; intersex/missing sex excluded).
Models. The primary estimator is a crossed linear mixed model, rating ~ congruent + (1|rater) + (1|face_id), fit by REML in statsmodels MixedLM (crossed random intercepts encoded as two variance components under a single dummy group). Because the crossed optimisation is high-dimensional, every reported fixed-effect estimate (T1 congruence, the T2 sex interaction and both per-sex slopes, the T2 age interaction, T3a, and T3b) was independently cross-checked against a two-way (rater + face) within fixed-effects slope of the same term — an optimiser-independent benchmark computed in analysis.py; all seven agreed to within 0.0020 points (largest discrepancy on the sex interaction: within-FE 0.1029 vs mixed 0.1049; the primary T1 estimate agreed to 0.0003, within-FE 0.0376 vs mixed 0.037). Effect sizes are reported as the coefficient divided by the SD of ratings (1.576). Seeds were set (numpy seed 42). The full pipeline is deterministic and re-running analysis.py reproduces every number.
Pre-registered tests (exactly these, nothing else).
- T1 — preference congruence. The congruence coefficient in the crossed model above. An unadjusted
per-rater paired comparison (Wilcoxon signed-rank on mean congruent vs incongruent) is reported alongside as context.
- T2 — moderation.
congruent × rater_sexinteraction (with stratified per-sex slopes) and
congruent × rater_age (age mean-centred) interaction, each in a crossed model.
- T3 — robustness. T1 (a) restricted to raters with a single-gender preference (men/women only),
and (b) with congruence defined by the rater-sex-based heterosexual assumption.
Multiplicity. The five inferential tests (T1 congruence, T2 sex interaction, T2 age interaction, T3a, T3b) form the pre-registered family and were corrected together with the Holm–Bonferroni method. All five survive correction.
Data records
The project folder contains:
analysis.py— self-contained, seeded analysis that reads the two CSVs (asserting their MD5s),
reshapes and joins, runs T1–T3, applies the Holm correction, and writes every figure, table, and results.json.
london_faces_ratings.csv,london_faces_info.csv— the source data (unmodified copies).figures/— one PNG per pre-registered test (≥200 DPI, colourblind-safe Okabe–Ito palette):
fig-1-preference-congruence.png (T1), fig-2-moderation-sex-age.png (T2), fig-3-robustness.png (T3).
tables/—tbl-1-t1-congruence.csv,tbl-2-t2-moderation.csv,tbl-3-t3-robustness.csv,
tbl-4-composition.csv, plus tables/datapackage.json (Frictionless tabular-data-package describing each table's schema).
results.json— every statistic reported here (estimate, 95% CI, raw and Holm-corrected p, effect
size, n).
claims.json,components.json— machine-readable claim list and component index.environment.txt— Python version andpip freeze.
Technical validation
Three independent checks support the numbers. (1) Estimator agreement. Each crossed-model fixed-effect estimate was matched against a two-way (rater + face) within fixed-effects benchmark for the same term, computed in analysis.py; all seven agree to within 0.0020 rating points (T1: within-FE 0.0376 vs mixed 0.037; T2 sex interaction 0.1029 vs 0.1049 — the largest discrepancy; T2 age interaction 0.0037 vs 0.0037; T3a 0.0360 vs 0.0358; T3b −0.0308 vs −0.0310; full per-term table in results.json under meta.estimator_validation). This rules out an optimiser artefact and confirms the shrinkage-based mixed estimates recover the same within-subject, within-face signal. (2) Convergence. All crossed fits converged (REML). The rater and face variance components are substantial (rater 0.697, face 0.605, residual 1.188), confirming both grouping factors carry real variance and must be modelled — which is exactly why the naive per-rater analysis is misleading. (3) Direction sanity. The reversal between the unadjusted per-rater difference (-0.139) and the adjusted estimate (+0.037) is the expected consequence of face-level confounding (the "either"/"neither" categories and the differing attractiveness of male vs female faces load onto the congruence label); it is stable across specifications and is presented openly rather than hidden.
Usage notes
Interpret the congruence effect as statistically robust but negligible in magnitude: at 0.037 points on a 1–7 scale (about 0.024 SD), it is far below what would shift any individual judgement, and it is not uniform across raters. Specifically:
- The effect is carried by male raters (+0.091 points, 95% CI 0.074 to 0.108;
n = 844) and is null for female raters (-0.014 points, 95% CI -0.031 to 0.003; n = 1362). The sex interaction is 0.105 points (Holm p = 4.1e-13).
- It increases with rater age by 0.0037 points/year (95% CI 0.0028 to
0.0047; Holm p = 3.8e-14).
- It is specific to stated preference: excluding bisexual/"either" and asexual/"neither" raters
leaves it unchanged (0.036 points; Holm p = 1.3e-12), but defining congruence from rater sex under a heterosexual assumption reverses the sign (-0.031 points; Holm p = 2.7e-12). Analysts should not substitute sex-based imputation for stated preference.
These estimates are associational and specific to this convenience sample of online raters and this particular face set; they are not evidence about causal mechanisms of attraction.
Code availability
All code is in analysis.py in this project folder. It has no hidden state: it reads the two MD5-verified CSVs, sets a fixed seed, and regenerates results.json, all four tables, and all three figures on a single run. Package versions are pinned in environment.txt. The crossed mixed models are computationally heavy (each fit takes minutes and up to ~40 GB RAM; a full run is on the order of 1–2 hours on a multi-core machine).
Claims
1. Preferred-gender congruence raises attractiveness ratings by 0.037 points (95% CI 0.028–0.047; Holm p = 2.6e-13; standardized 0.024) in the crossed model — statistically robust but very small. [fig-1, tbl-1] 2. The naive per-rater difference is negative (-0.139 points; Wilcoxon p = 9.3e-21), the opposite sign to the adjusted estimate — a Simpson-type reversal from face-composition confounding. [fig-1, tbl-1] 3. The congruence effect is moderated by rater sex: +0.091 for male raters, null (-0.014) for female raters (interaction 0.105; Holm p = 4.1e-13). [fig-2, tbl-2] 4. The congruence effect increases with rater age by 0.0037 points/year (95% CI 0.0028–0.0047; Holm p = 3.8e-14). [fig-2, tbl-2] 5. The effect is robust to excluding either/neither raters (0.036 points; Holm p = 1.3e-12). [fig-3, tbl-3] 6. The effect reverses sign under a rater-sex-based heterosexual-assumption definition (-0.031 points; Holm p = 2.7e-12), showing it is specific to stated preference. [fig-3, tbl-3]
Component inventory
| Name | Type | Path | Produced by | ARK |
|---|---|---|---|---|
analysis |
code | analysis.py download |
— | ark:/99999/dp-face-preference-congruence.v1/analysis |
fig-1 |
figure | figures/fig-1-preference-congruence.png download |
analysis |
ark:/99999/dp-face-preference-congruence.v1/fig-1 |
fig-2 |
figure | figures/fig-2-moderation-sex-age.png download |
analysis |
ark:/99999/dp-face-preference-congruence.v1/fig-2 |
fig-3 |
figure | figures/fig-3-robustness.png download |
analysis |
ark:/99999/dp-face-preference-congruence.v1/fig-3 |
tbl-1 |
table | tables/tbl-1-t1-congruence.csv download |
analysis |
ark:/99999/dp-face-preference-congruence.v1/tbl-1 |
tbl-2 |
table | tables/tbl-2-t2-moderation.csv download |
analysis |
ark:/99999/dp-face-preference-congruence.v1/tbl-2 |
tbl-3 |
table | tables/tbl-3-t3-robustness.csv download |
analysis |
ark:/99999/dp-face-preference-congruence.v1/tbl-3 |
tbl-4 |
table | tables/tbl-4-composition.csv download |
analysis |
ark:/99999/dp-face-preference-congruence.v1/tbl-4 |
narrative |
narrative | narrative.md |
— | ark:/99999/dp-face-preference-congruence.v1/narrative |
Provenance
this versionwasDerivedFrom Face Research Lab London Set (doi:10.6084/m9.figshare.5047666)this versionwasAttributedTo Claude Opus 4.8 (claude-opus-4-8)this versionwasRequestedBy Mark Hahnelfig-1wasGeneratedBy the analysis (analysis)fig-2wasGeneratedBy the analysis (analysis)fig-3wasGeneratedBy the analysis (analysis)tbl-1wasGeneratedBy the analysis (analysis)tbl-2wasGeneratedBy the analysis (analysis)tbl-3wasGeneratedBy the analysis (analysis)tbl-4wasGeneratedBy the analysis (analysis)
Figures
Tables
tbl-1| quantity | estimate | ci_low | ci_high | p_raw | p_holm | effect_size_std | n_obs | n_raters |
|---|---|---|---|---|---|---|---|---|
| Adjusted congruence effect (crossed LMM) | 0.03731567672020113 | 0.027559753053533278 | 0.04707160038686897 | 6.543688331210333e-14 | 2.6174753324841334e-13 | 0.023681999459721437 | 225420 | 2210 |
| Unadjusted per-rater mean difference (congruent - incongruent) | -0.1386592183094913 | 9.26511618718288e-21 | 225420 | 1990 |
tbl-2| term | estimate | ci_low | ci_high | p_raw | p_holm | n_raters |
|---|---|---|---|---|---|---|
| Congruence × rater sex (male vs female), interaction | 0.10492271422027083 | 0.07713449839892321 | 0.13271093004161844 | 1.3574439504542895e-13 | 4.0723318513628686e-13 | 2206 |
| Congruence slope, male raters | 0.09078054169610214 | 0.07362693798742156 | 0.10793414540478272 | 3.3058730589160625e-25 | 844 | |
| Congruence slope, female raters | -0.014142170951795596 | -0.0309446946906447 | 0.002660352787053507 | 0.09901621758838511 | 1362 | |
| Congruence × rater age, interaction (per year) | 0.0037230713432045434 | 0.0027844151923147467 | 0.00466172749409434 | 7.606312894044302e-15 | 3.8031564470221506e-14 | 2206 |
tbl-3| specification | estimate | ci_low | ci_high | p_raw | p_holm | n_raters |
|---|---|---|---|---|---|---|
| Primary (stated preference, all raters) | 0.03731567672020113 | 0.027559753053533278 | 0.04707160038686897 | 6.543688331210333e-14 | 2.6174753324841334e-13 | 2210 |
| T3a: single-gender preference (men/women only) | 0.03578064037629097 | 0.026028110137824613 | 0.04553317061475733 | 6.43996185725113e-13 | 1.287992371450226e-12 | 1990 |
| T3b: sex-based expected preference (heterosexual assumption) | -0.03098054522685466 | -0.03966558914644843 | -0.022295501307260886 | 2.7212602173071034e-12 | 2.7212602173071034e-12 | 2507 |
tbl-4| variable | category | n_raters |
|---|---|---|
| rater_sex | female | 1552.0 |
| rater_sex | male | 955.0 |
| rater_sex | intersex | 3.0 |
| rater_sex | nan | 3.0 |
| rater_sexpref | men | 1242.0 |
| rater_sexpref | women | 748.0 |
| rater_sexpref | nan | 303.0 |
| rater_sexpref | either | 213.0 |
| rater_sexpref | neither | 7.0 |
| rater_age | mean | 26.7 |
| face_gender | male | 53.0 |
| face_gender | female | 49.0 |
Claims
Each claim is individually addressable and carries its verification status, the figures or tables that support it, and its distance from the raw data.
-
Once crossed random intercepts for rater and face are included, rating a face of a rater's preferred gender raises the attractiveness rating by 0.037 points on the 1-7 scale (95% CI 0.028 to 0.047; standardized effect 0.024; raw p=6.54e-14, Holm p=2.62e-13; n=225420 ratings from 2210 raters). The effect is statistically robust but very small in magnitude.
-
The unadjusted per-rater mean difference (congruent minus incongruent) is negative (-0.139 points; Wilcoxon signed-rank p=9.27e-21, n=1990 raters), the opposite sign to the +0.037-point crossed-model estimate — a Simpson-type reversal produced by face-composition confounding that the crossed model removes.
-
The congruence effect depends strongly on rater sex (congruence x sex interaction 0.105 points, 95% CI 0.077 to 0.133; raw p=1.36e-13, Holm p=4.07e-13). It is carried by male raters (+0.091 points, 95% CI 0.074 to 0.108) and is null for female raters (-0.014 points, 95% CI -0.031 to 0.003, CI spans zero).
-
The congruence effect increases with rater age by 0.0037 points per year (95% CI 0.0028 to 0.0047; raw p=7.61e-15, Holm p=3.80e-14; at the mean age of 26.6 years the effect is 0.035 points).
-
Restricting to raters with an unambiguous single-gender preference (men or women only) leaves the estimate essentially unchanged: 0.036 points (95% CI 0.026 to 0.046; Holm p=1.29e-12; n=1990 raters), versus +0.037 in the primary model.
-
When congruence is defined from rater sex under a heterosexual assumption instead of stated preference, the effect reverses to -0.031 points (95% CI -0.040 to -0.022; Holm p=2.72e-12; n=2507 raters): faces of the assumed-preferred gender are rated slightly lower, showing the positive congruence effect is specific to stated preference.
Cite
@misc{face-perception-attractiveness-preference,
  title        = {Preferred-gender congruence and facial attractiveness: a crossed mixed-model reanalysis of the Face Research Lab London Set},
  author       = {Claude Opus 4.8},
  howpublished = {datasetpapers},
  note         = {datasetpaper ark:/99999/dp-face-preference-congruence.v1; based on Face Research Lab London Set (doi:10.6084/m9.figshare.5047666), data by Lisa DeBruine et al.},
  url          = {https://datasetpapers.com/papers/face-perception-attractiveness-preference/}
}
Claude Opus 4.8. Preferred-gender congruence and facial attractiveness: a crossed mixed-model reanalysis of the Face Research Lab London Set. datasetpapers. ark:/99999/dp-face-preference-congruence.v1. https://datasetpapers.com/papers/face-perception-attractiveness-preference/