Marcescent litter decomposes more slowly than litter that falls straight to the ground — which invites an obvious explanation: it must be chemically tougher. A compositionally corrected test of the same dataset's own chemistry says the opposite is true.
The Leaves That Won't Let Go
Every winter, oak and beech trees across the temperate world do something odd: they hold onto their dead leaves. The wind strips most trees bare by December, but marcescent branches stay dressed in brown, curled, unmistakably dead foliage until spring finally pushes it off. The same trait — dead tissue that persists instead of falling on schedule — turns out to be widespread in herbaceous plants too, not just trees.
A 2024 common-garden study tracked exactly this in 39-40 temperate herb species, burying marcescent (still-attached, standing-dead) and directly shed litter side by side in the same soil and watching what happened over six months. The marcescent litter took longer to break down.
The natural next question is why. And the natural first guess is chemistry: tissue that spends a whole extra season standing exposed, rather than falling straight into contact with soil microbes, should end up chemically tougher — more lignin-like, more recalcitrant, harder for decomposers to attack. This piece tests that guess directly, using the same dataset's own chemistry measurements. The guess turns out to be backwards.
Herbs, Not Just Trees — and a Statistical Trap
The species behind these numbers are not oaks or beeches — they are common-garden herbs like yarrow (Achillea), grasses like Bromus and Festuca, and forbs like Circaea and Inula, 33 to 40 species grown together at the Institute of Botany CAS in Pruhonice, Czech Republic. Marcescence in these plants works the same way it does in trees: dead stems and leaves stay standing rather than dropping straight to the ground.
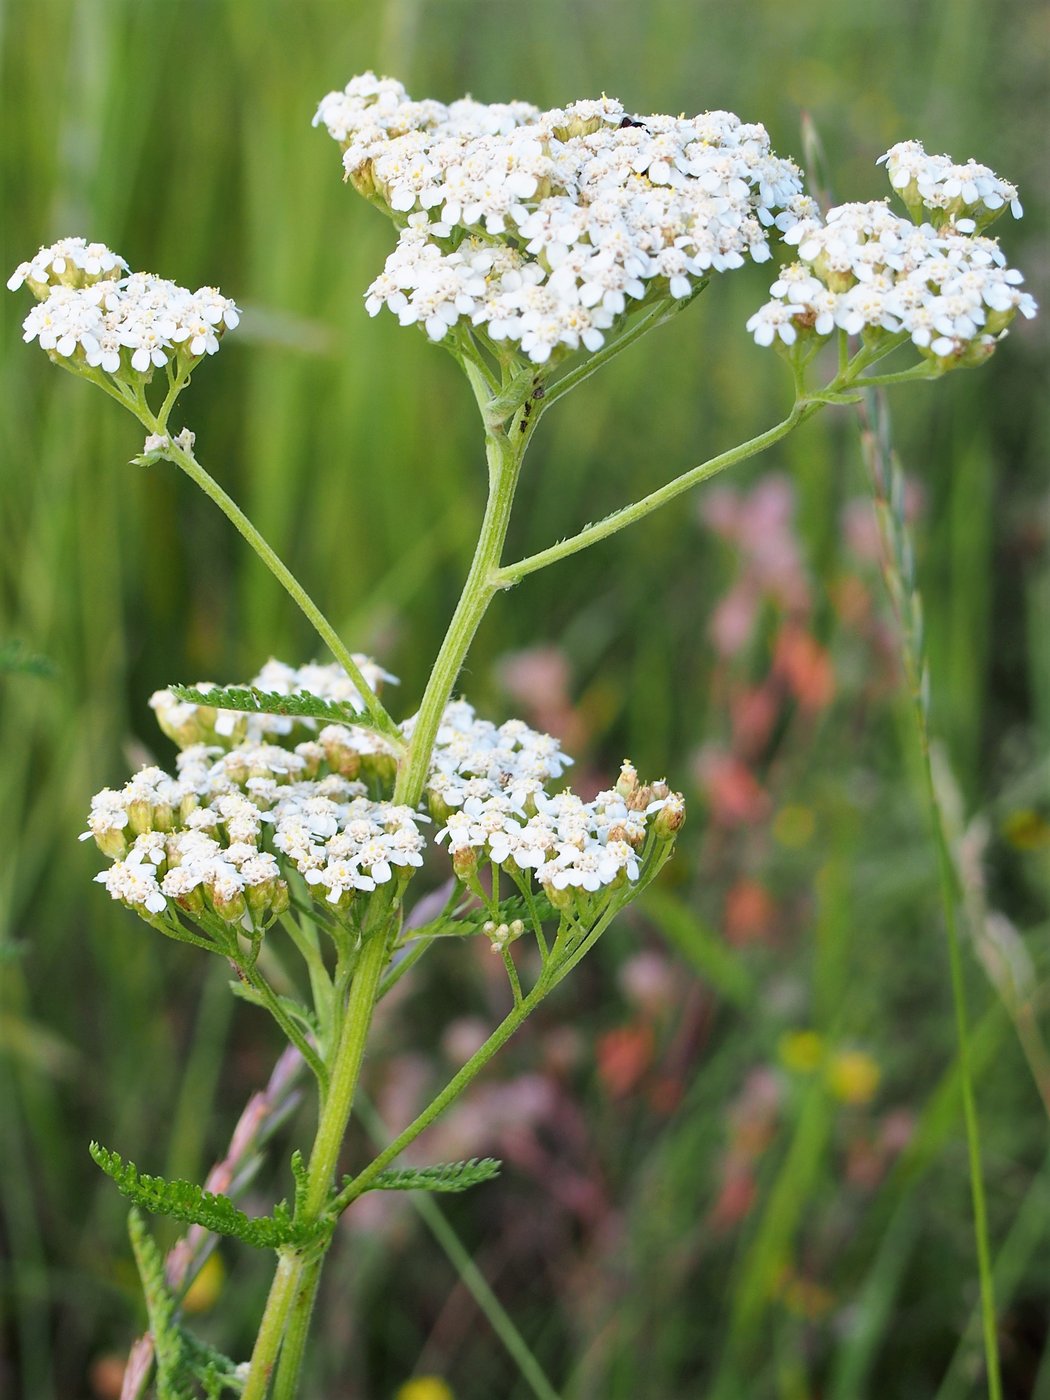
The original 2024 study already found part of the answer: forbs (herbs with complex stem-and-leaf architecture) showed a much bigger marcescent-vs-shed decomposition gap than grasses did, and it proposed two mechanisms working together — forbs retain tougher stems as marcescent tissue while shedding easier-to-decompose leaves directly, and marcescent tissue in general gets less microbial colonization because it spends time exposed to sun, freeze-thaw, and rain before it ever reaches the soil.
This piece asks a narrower, more testable version of the chemistry half of that story: across the whole species pool, does marcescent litter's bulk chemical composition actually look more recalcitrant? Answering that correctly requires one statistical correction most casual analyses skip. The five FTIR chemical classes measured here — aliphatics, carboxylics, polypeptides, polyphenolics, polysaccharides — are percentages that sum to 100%, which makes them a composition, not five independent numbers. Test raw percentages with ordinary statistics and you're testing an artifact of the closure constraint as much as any real signal. The fix is a centred log-ratio (CLR) transform, which is what this analysis uses throughout.
The Recalcitrance Marker Goes the Wrong Way
On the CLR-corrected scale, marcescent litter's polyphenolic share — the recalcitrance marker, the bulk-chemistry proxy for hard-to-degrade, lignin-like compounds — is significantly lower than shed litter's, not higher (paired Wilcoxon signed-rank, p = 0.000225, n = 33 species, median CLR difference −0.40). The effect is large by conventional standards (rank-biserial r = 0.64).
This is not a result carried by a couple of extreme species. 28 of the 33 species (84.8%) individually show lower marcescent polyphenolics than their own shed litter — a consistent, species-by-species pattern, not a fluke of averaging.
The species with the steepest drop include Cirsium canum, whose polyphenolic CLR value falls from 1.33 in shed litter to 0.14 in marcescent litter, and Circaea lutetiana and Agrostis capillaris, both dropping by roughly 0.9-1.0 log-ratio units. None of the biggest movers run the other direction.
The Labile Marker Goes Up, Too
It's not just that the recalcitrance marker falls — the labile marker rises to match. Marcescent litter's CLR polysaccharide share is significantly higher than shed litter's (p = 0.014730, n = 33, median CLR difference +0.18), a medium-to-large effect (rank-biserial r = 0.42).
Again the direction holds broadly across the species pool: 25 of 33 species (75.8%) show higher marcescent polysaccharides than their paired shed litter.
Circaea lutetiana shows the single largest polysaccharide gain (from −0.63 in shed litter to +0.47 in marcescent litter), and — notably — it's also one of the species with the steepest polyphenolic drop from the previous section, making it the clearest individual case of the whole pattern: less recalcitrant, more labile, in the same plant.
Across the full species pool, though, the two shifts aren't tightly coupled to each other (Spearman rho = −0.25, not significant, n = 33) — most species show one or both shifts, but a big polyphenolic drop in one species doesn't reliably predict a big polysaccharide gain in that same species. The two markers move together at the population level, not lockstep at the individual level.
What About the Decomposers Themselves?
If it isn't bulk chemistry, maybe it's the decomposer community — a shift toward fungi (typically slower, more specialized decomposers of tough compounds) and away from bacteria (typically faster generalists) could independently explain slower breakdown. The data doesn't show that shift: the fungi:bacteria PLFA ratio doesn't differ significantly between marcescent and shed litter (paired Wilcoxon, p = 0.291, n = 22 species, a small effect r = 0.22).
But "not significant" is doing a lot of quiet work in that sentence, and this analysis doesn't let it hide. A TOST equivalence test — asking whether the difference can be statistically bounded within a 1.5x margin, the standard way to distinguish "no detectable difference" from "proven to be the same" — also fails (p = 0.139, not equivalent at α = 0.05). The observed mean difference (−0.154) is itself numerically inside the ±0.4055 margin, but the test still fails because the confidence interval around it is too wide at n = 22 to rule out a true difference as large as the margin. So this is not a demonstrated absence of a community shift. It's an underpowered null that simply can't rule either way.
Part of why: the fungi:bacteria test runs on only 22 paired species, a third fewer than the 33 available for the chemistry tests, because 11 species lack matching microbial-biomass measurements. Less data, less power, less confidence in a "no effect" reading.
Does This Hold Up?
Both chemistry results survive correction for testing three hypotheses at once — the polyphenolic result stays significant after Benjamini-Hochberg (adjusted p = 0.00067) and after the stricter Holm correction (adjusted p = 0.00067); the polysaccharide result stays significant too (BH p = 0.022, Holm p = 0.029). The fungi:bacteria null was already the largest p-value in the family, so correction changes nothing there.
Ranking the three tests by effect size tells the same story a different way: polyphenolics is a large effect (r = 0.64), polysaccharides a medium one (r = 0.42), and the community shift a small, non-significant one (r = 0.22). The chemistry signal isn't just statistically real — it's comparatively strong.
One honesty check worth naming: three species (Achillea collina, Avenula pubescens, Linum flavum) have one wildly extreme CLR value each — a side effect of a near-zero measured percentage in one sample triggering the log-transform's zero-guard. Because the tests here are rank-based rather than mean-based, these three rows barely move the result; they change where a species ranks, not the outcome of the test. Any chart of raw values still has to be built with that in mind.
And the numbers themselves check out: an independent re-run of the analysis code, on a different software environment than the one that produced the published results, reproduced all 30 compared values exactly — zero mismatches, zero drift.
So What Is Slowing It Down?
Put the pieces together and the bulk-chemistry explanation for marcescent litter's slower decomposition doesn't survive contact with the data — if anything, marcescent litter looks like the more digestible material, not the tougher one. The decomposer-community explanation doesn't survive either, but for a different reason: the data simply isn't powerful enough to say.
That leaves the explanation the original study also pointed toward: something about the physical experience of standing dead for a season — sun exposure, freeze-thaw cycling, rain, structural drying — rather than the litter's bulk chemical makeup, is the more plausible driver. Decomposition rate is one of the primary levers on how fast ecosystems cycle carbon and nutrients, so getting the mechanism right, not just the pattern, matters for how marcescence gets modeled beyond this one species pool.
It's a reminder that "why does this plant do this" and "why does the result of this plant doing this behave the way it does" can have completely separate answers — marcescence itself may exist for reasons involving frost protection or deterring browsing deer, while its downstream chemistry follows a logic of its own, one that a naive chemistry-first hypothesis gets backwards.
This dataset measures litter chemistry (FTIR) and microbial biomass (PLFA) only — it does not itself measure decomposition rate. The "marcescent litter decomposes slower" finding is inherited context from the original 2024 common-garden study; what this analysis adds is a direct test, on the same species pool, of whether bulk chemistry or decomposer community explains that slowdown.