A Test With a Blind Spot
Every one of the 436 modern bone-collagen samples in this compilation passes the standard test archaeologists use to decide whether a sample is trustworthy enough to analyse. Actinopterygii (ray-finned fish): 100% inside the window. Mammalia: 100% inside the window. By the field's own rulebook, all 436 samples are equally “good.”
But they are not chemically the same. Fish collagen runs measurably, consistently lower in atomic C:N than mammal collagen — a median of 3.16 versus 3.22, a difference (Hodges–Lehmann shift −0.060, 95% CI −0.070 to −0.050) that is not a rounding artifact but a large effect by any standard measure (Cliff's δ = −0.60), and about as far from chance as a comparison in this field ever gets (Mann–Whitney p = 1.7 × 10⁻¹⁵).
Put those two facts side by side and you get the whole story: a real, well-supported, class-linked chemistry difference, hiding in plain sight, entirely inside a test built to catch exactly this kind of problem.
An archaeologist screens every bone sample with one test before trusting it. Which of these two would fail?
Both pass. Every one of 436 samples in this dataset does. But they are not the same collagen.
Full observed range and median for each class, against the conventional 2.9–3.6 acceptance window. Sample A sits at the fish median, Sample B at the mammal median.
A Forty-Year-Old Gatekeeper
The acceptance window at the center of this story — atomic C:N between 2.9 and 3.6 — comes from a single 1985 Nature paper by Michael DeNiro, which argued that collagen outside that range has probably been chemically altered after burial and shouldn't be trusted for dietary reconstruction. For forty years, it has been the default screening test in archaeological and paleoecological isotope labs: pass it, use the sample; fail it, throw it out.
The dataset behind this analysis is the sample-level table underlying Eric Guiry and Paul Szpak's 2020 re-examination of that rule (Methods in Ecology and Evolution) — 436 modern vertebrate collagen samples across 194 named taxa, compiled from the published literature, with a full amino-acid profile, elemental composition, and atomic C:N ratio recorded for every sample.
Two classes dominate the compilation: ray-finned fish (Actinopterygii, 290 samples, 66.5%) and mammals (Mammalia, 86 samples, 19.7%) — together 86.2% of the dataset, and the two best-sampled groups by a wide margin over the eight minor classes present.
One methodological note worth keeping visible: fish C:N is not normally distributed (Shapiro–Wilk p = 1.2 × 10⁻¹³), so every comparison in this analysis uses nonparametric statistics — medians and rank correlations, not means and Pearson correlations — which is also why effect sizes here are reported as Cliff's δ and Hodges–Lehmann shifts rather than differences in means.
Sample count by taxonomic class (n = 436). Fish and mammals — the two classes analysed in depth here — are highlighted; the eight minor classes are shown for scale only.
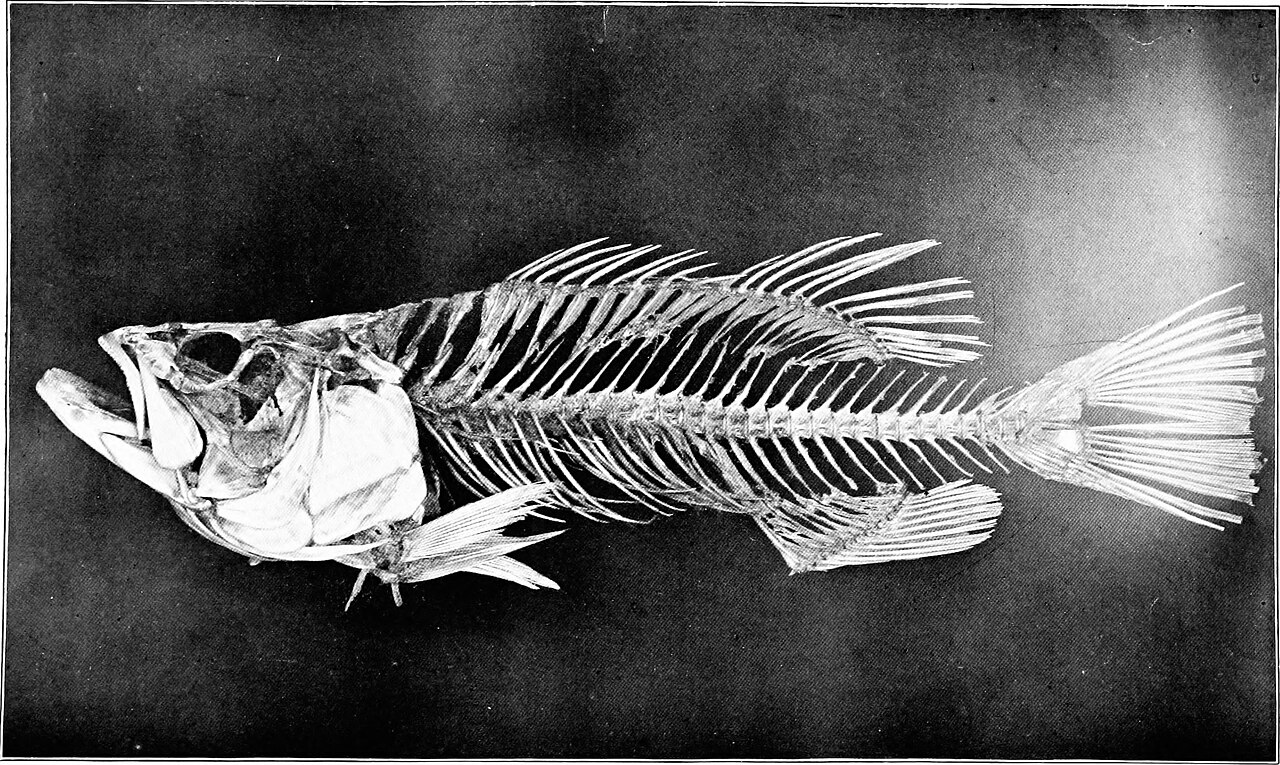
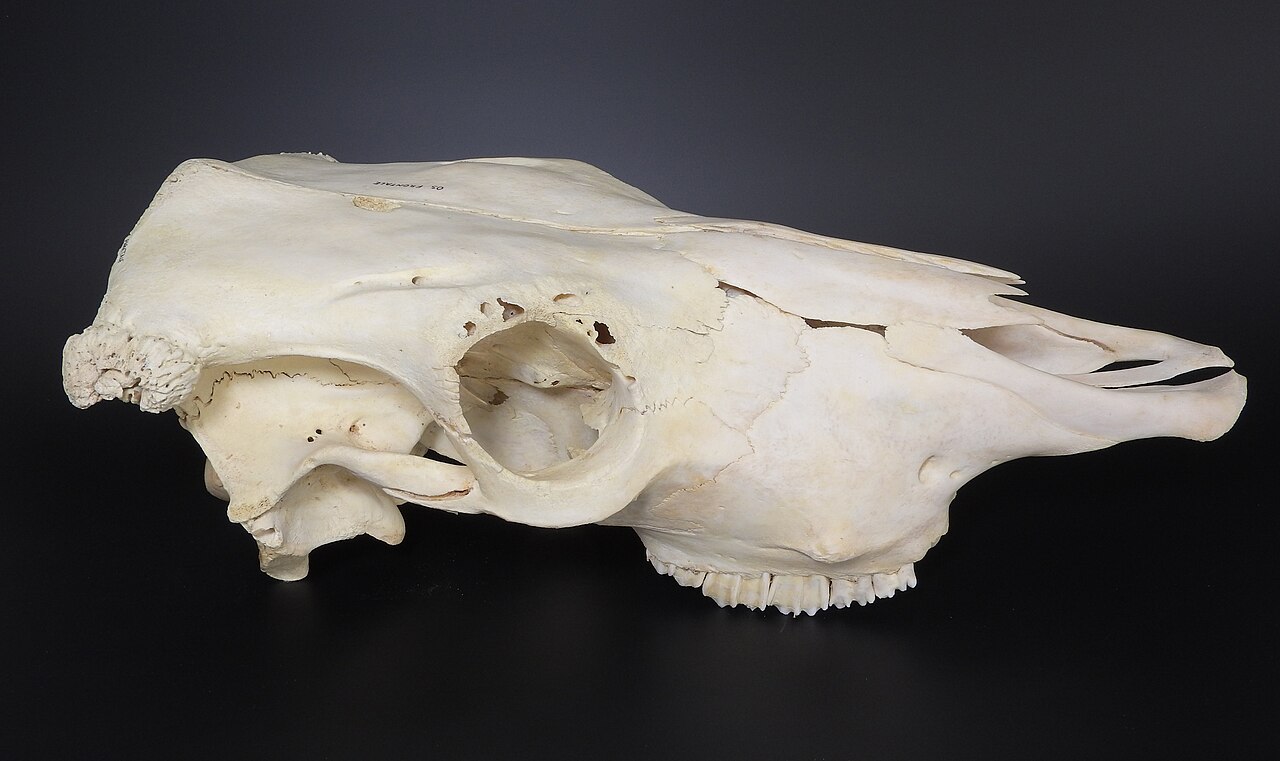
Fish Run Lower
The core numbers: fish collagen (n = 290) has a median atomic C:N of 3.16 (IQR 3.12–3.20); mammal collagen (n = 86) has a median of 3.22 (IQR 3.183–3.24). Fish also span a wider range (3.00–3.58) and a larger standard deviation (0.064 vs. 0.045) than mammals — consistent with “fish” here meaning ray-finned fish broadly, a taxonomically far more heterogeneous group than “mammal” in this compilation. The gap is small in absolute terms but statistically about as solid as this kind of comparison gets, and by Cliff's δ (−0.60) it counts as a large effect, not a marginal one.
This isn't a fluke of the compilation. Biochemists studying fish collagen for entirely different reasons — food science, biomaterials — have independently documented that cold-adapted fish collagen has reduced hydroxyproline content and much lower thermal stability (denaturing around 25–30°C) than mammalian collagen (39–40°C), reflecting real adaptation to different body temperatures. A class-level difference in amino-acid chemistry, and therefore in bulk C:N, is exactly what that independent biochemistry literature would predict.
Full range (thin bar), interquartile range (thick bar), and median (tick) of atomic C:N for each class, over the shaded 2.9–3.6 acceptance window.
One Amino Acid Explains Most Of It
Across all 436 samples, atomic C:N is negatively correlated with glycine content (Spearman ρ = −0.616, p = 6.6 × 10⁻⁴⁷) — and the relationship isn't just an artifact of pooling two different classes together. It holds independently within fish alone (ρ = −0.630, p = 1.6 × 10⁻³³) and within mammals alone (ρ = −0.475, p = 3.9 × 10⁻⁶): more glycine, lower C:N, in both groups separately.
Testing all 19 reported amino-acid residues against C:N, with false-discovery-rate correction for running 19 tests at once, glycine comes out on top: the single strongest negative correlate (ρ = −0.616, q = 1.3 × 10⁻⁴⁵), ranked #1 of 19 by correlation strength. Sixteen of the 19 residues are statistically significant after correction. The imino acids proline (ρ = +0.411) and hydroxyproline (ρ = +0.443) sit at the opposite end, among the strongest positive correlates — with leucine the single strongest positive correlate overall (ρ = +0.499).
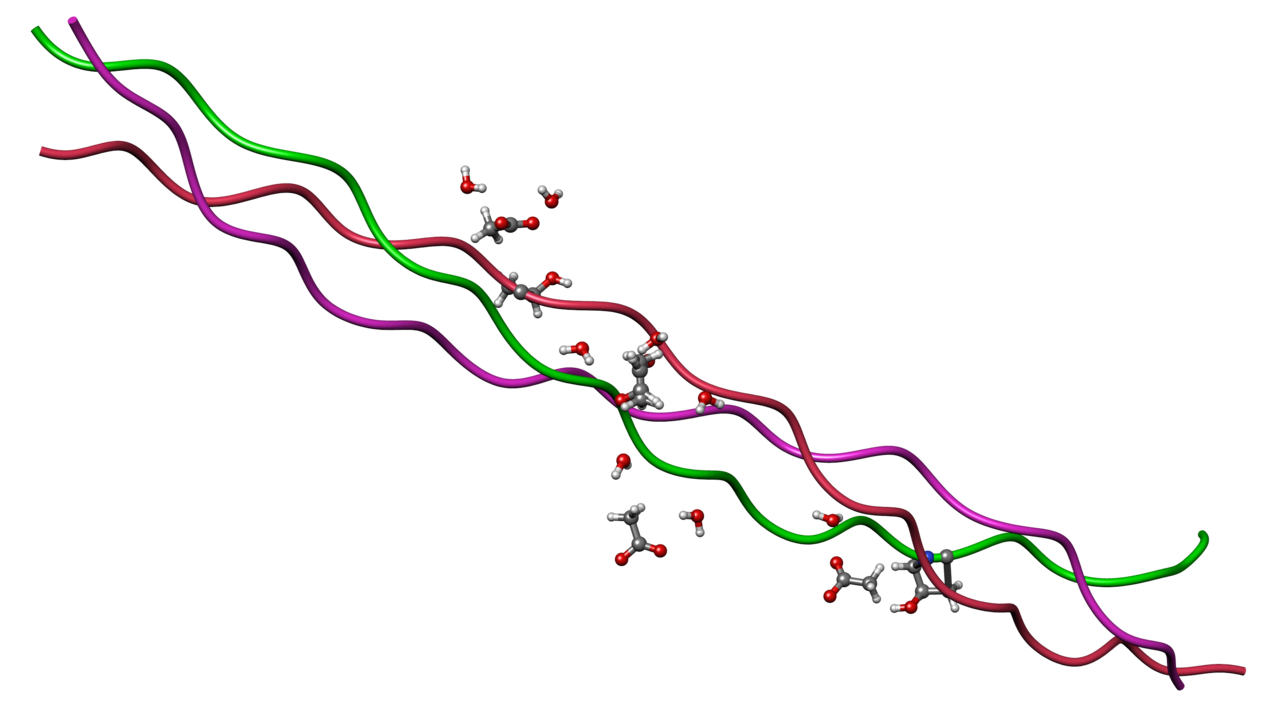
This has a structural explanation, not just a statistical one. Collagen is built from repeating Gly-X-Y triplets, and glycine — the smallest possible amino acid — has to occupy every third position because it's the only residue small enough to fit inside the cramped core of the triple helix. That structural requirement makes glycine roughly a third of all collagen residues, several times its share in almost any other protein, and because glycine's own carbon-to-nitrogen atom ratio is low while proline and hydroxyproline's is comparatively high, an animal's glycine share mechanically pulls its bulk C:N in a predictable direction. The correlation isn't a coincidence the data happened to turn up — it's collagen's own architecture showing through in the elemental chemistry.
Spearman correlation of each of the 19 amino-acid residues with atomic C:N (teal = negative, amber = positive). Faded bars are not significant after FDR correction.
Stress-Testing the Difference
A compilation this size, pooled from many original studies, could hide all sorts of artifacts — so the fish-versus-mammal gap was re-run four different ways. Stratified by an undocumented source/batch code, the effect holds in both strata with enough samples to test (HL shift −0.050 and −0.060; the third stratum was correctly skipped rather than forced, because it contains zero mammal samples). Collapsed to one median value per named species — guarding against a handful of over-sampled species dominating the result — the effect if anything gets slightly larger (Cliff's δ −0.74, p = 1.3 × 10⁻⁸). Broadened to fish-plus-sharks versus mammals-plus-birds, it holds again (p = 3.8 × 10⁻¹⁸). Across every valid variant, the Hodges–Lehmann shift stays between −0.050 and −0.060 and Cliff's δ between −0.585 and −0.740, always with p below 1 × 10⁻⁵.
The species-collapse check exists for a specific reason: within the 86-row mammal group, two farmed species — Bos taurus (cattle, 22 rows) and Sus scrofa (pig, 18 rows) — supply 46.5% of all mammal observations between them, despite being only 2 of the dataset's 194 named taxa. That's a normal feature of a literature compilation, not a designed sample, but it's a fair worry: is the mammal median just cattle-and-pig physiology? Collapsing to species-level medians answers that directly — the difference survives, essentially unchanged in direction and significance, when cattle and pigs are worth exactly the same as every other named species.
None of this makes the finding causal. This is still a compilation of samples pulled from many original studies, tissue types, and lab setups, not a controlled experiment — the undocumented batch code is treated purely as an anonymous stratifier here, not as evidence of anything specific about those batches. What the robustness battery shows is that the fish-versus-mammal offset isn't an artifact of any one plausible confound the data can test for.
Click through the checks — the interval barely moves.
Inside the Window
Return to where this started: fish range from 3.00 to 3.58, mammals from 3.11 to 3.33, and the field's acceptance window runs 2.9 to 3.6. The class-level offset — 0.060 — is only 8.6% of the window's full width. Every sample, in both classes, sits entirely inside it. A lab applying the standard pass/fail rule would wave through all 436 samples without ever seeing the difference this analysis just spent five sections establishing.
That matters because stable-isotope archaeology routinely uses C:N-screened collagen to compare fish and mammal isotope values directly — reconstructing diets that mix marine and terrestrial protein is one of the field's most common questions. If a systematic, taxon-linked offset sits inside the window everyone already treats as uniformly clean, studies that pool or compare fish and mammal collagen without treating class as a covariate may be starting from baselines that already differ by a small, real amount — before any actual dietary signal enters the picture.
Guiry and Szpak's own published conclusion, reached independently with their own experimental data, points the same direction: they found the lowest reliable C:N values in modern mammal and bird collagen sat around 3.11–3.15, well inside DeNiro's original 2.9 lower bound, and proposed a narrower, more conservative floor for what counts as trustworthy modern collagen. This analysis, using the same compilation from a different angle, adds an independent line of evidence for the same underlying point.
None of this means the acceptance window should be abolished — every sample here still passed it, and a wider window that let in genuinely degraded collagen would be worse. It means the window was never meant to answer the question this data actually raises: not “is this sample degraded?” but “what should the expected, undegraded C:N even be, for this particular class of animal?” That's a harder question than a single number can answer.
window boundaries (2.9 / 3.6) fish: min, median, max mammal: min, median, max — pitched consistently higher, but still inside the boundaries.
If sound is off or unsupported, the stat above and the range chart in the opening section already show the same relationship visually.