
Datasetpaper · archaeometry / stable-isotope biogeochemistry
Modern collagen atomic C:N differs between fish and mammals and tracks glycine content
Data story Read the interactive, evidence-linked version of this paper →Paper is a compiled reading view, rendered from the underlying research object (an RO-Crate) — not hand-edited. Object shows that same object taken apart: its individually addressable components, their provenance, and the machine-readable exports agents can fetch directly. Switch above.
- Version
ark:/99999/dp-quality-control-for-modern-bone-collagen-stable-carbon-and-n.v1- Concept
ark:/99999/dp-quality-control-for-modern-bone-collagen-stable-carbon-and-n
Summary
The atomic carbon-to-nitrogen ratio (C:N) is the most widely used quality-control gatekeeper for accepting collagen into stable-isotope studies, with a conventional archaeological acceptance window of 2.9–3.6. Using a published compilation of modern vertebrate collagen amino-acid compositions and elemental data (n = 436 samples, 194 unique taxa), this secondary analysis asks two pre-registered questions: (Q1) does modern-collagen C:N differ between ray-finned fish (Actinopterygii) and mammals (Mammalia)? and (Q2) is C:N variation associated with amino-acid composition, in particular glycine — the most abundant collagen residue and the one with the lowest carbon-to-nitrogen atom ratio?
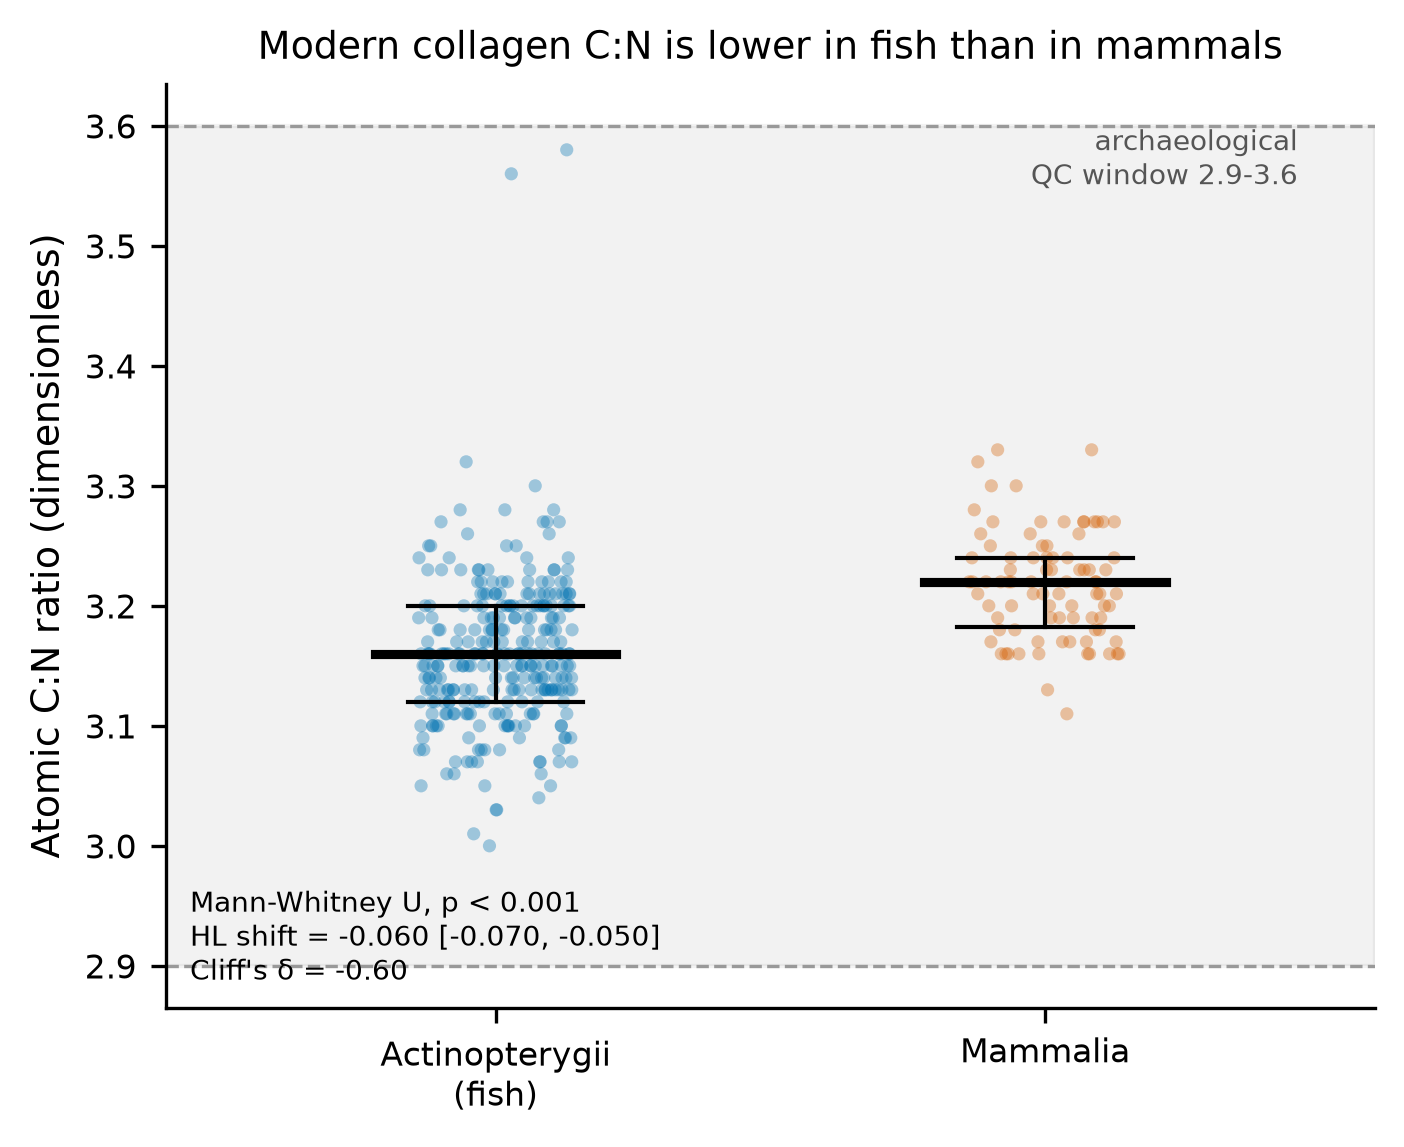
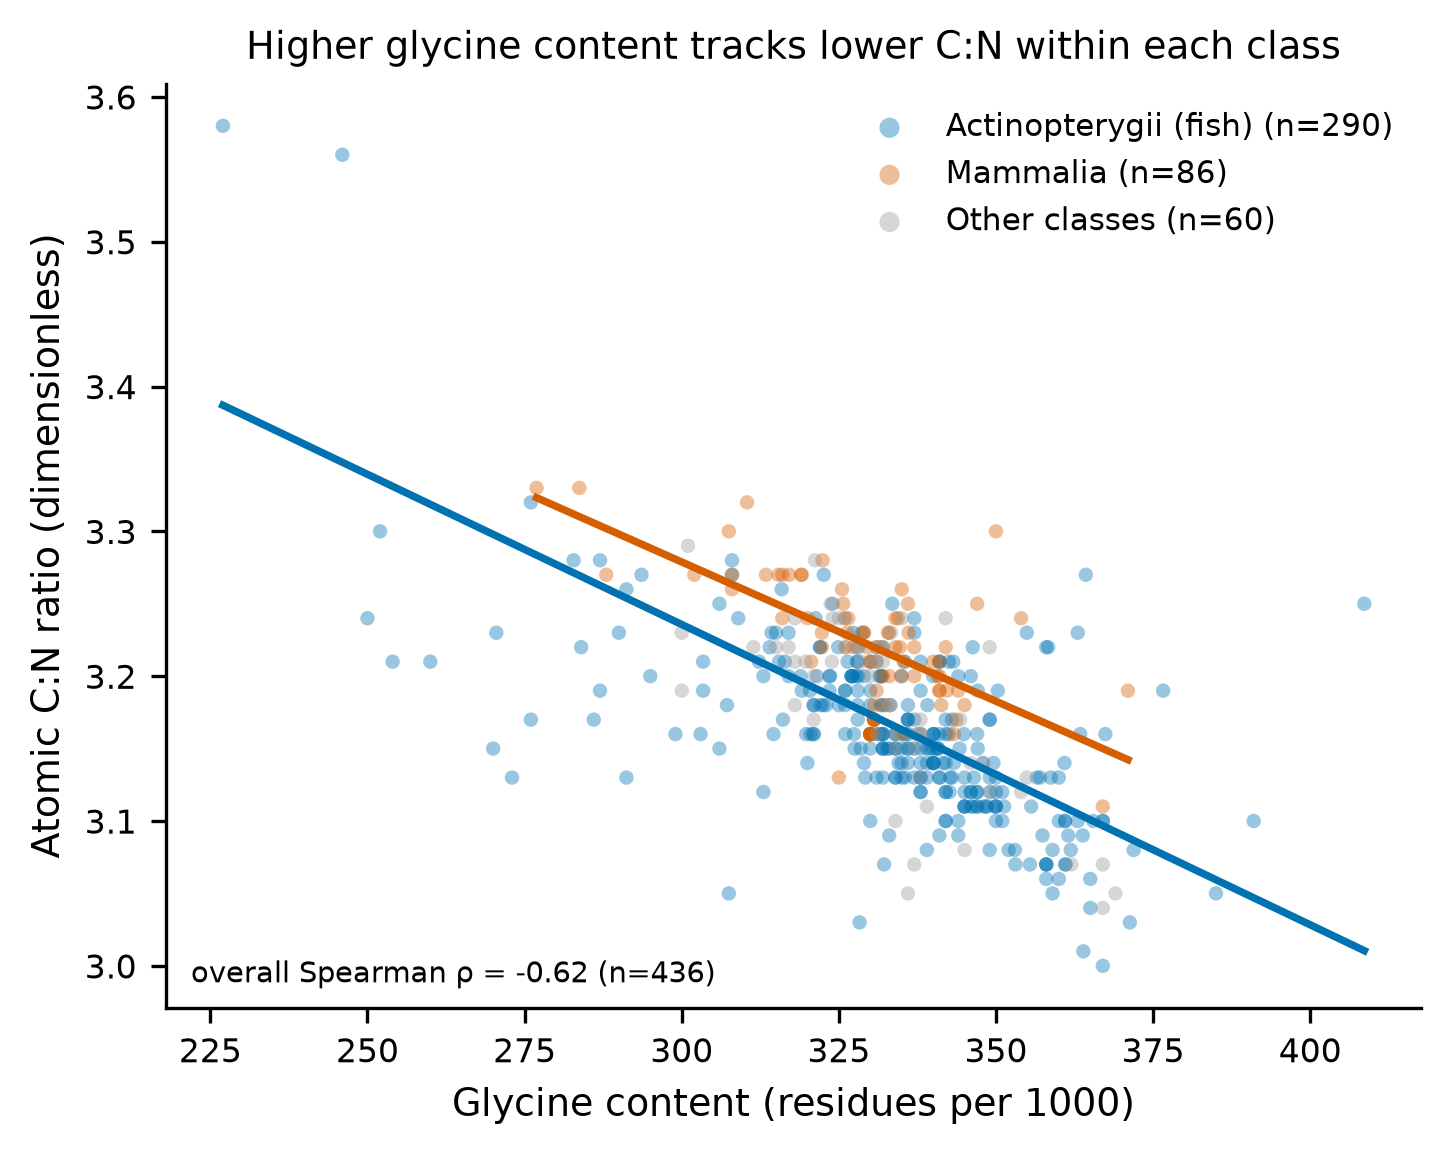
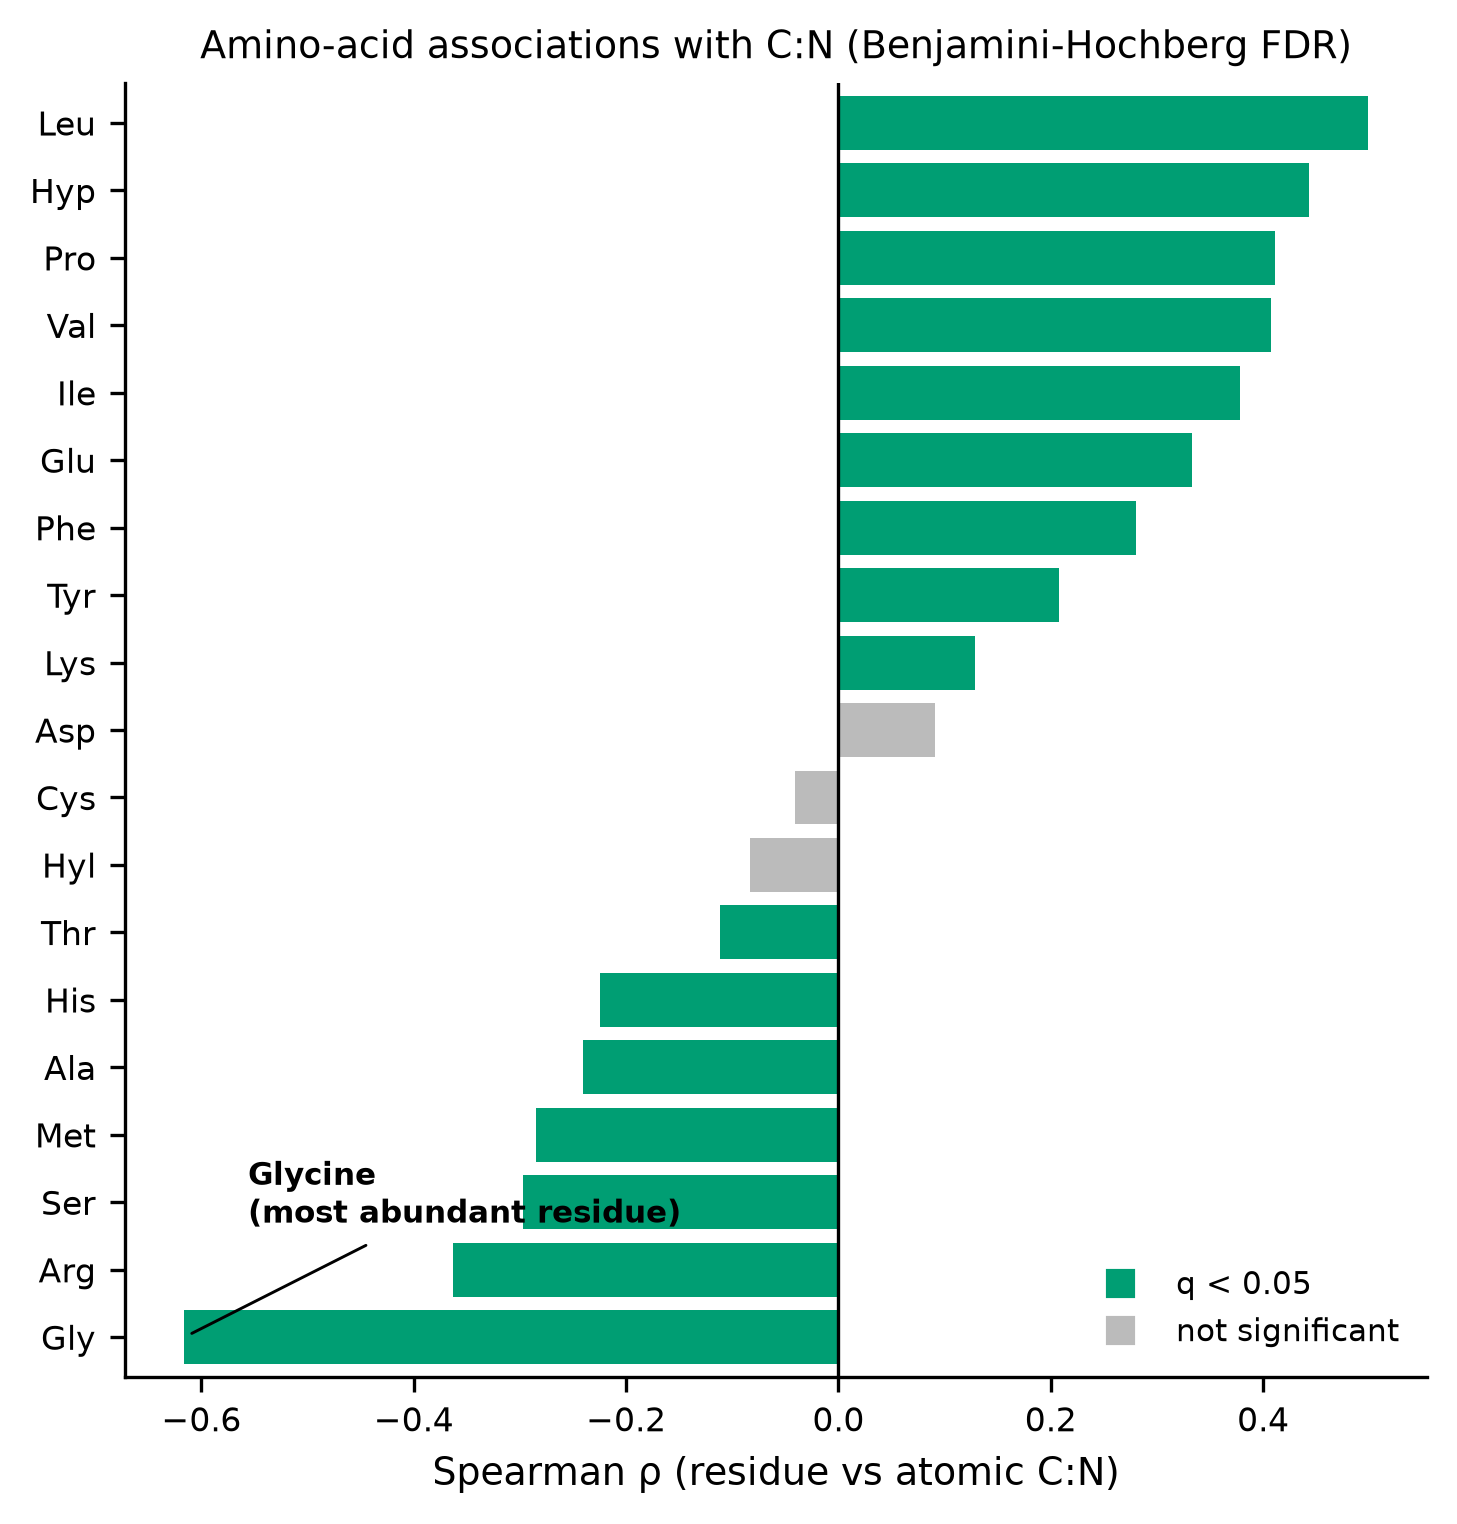
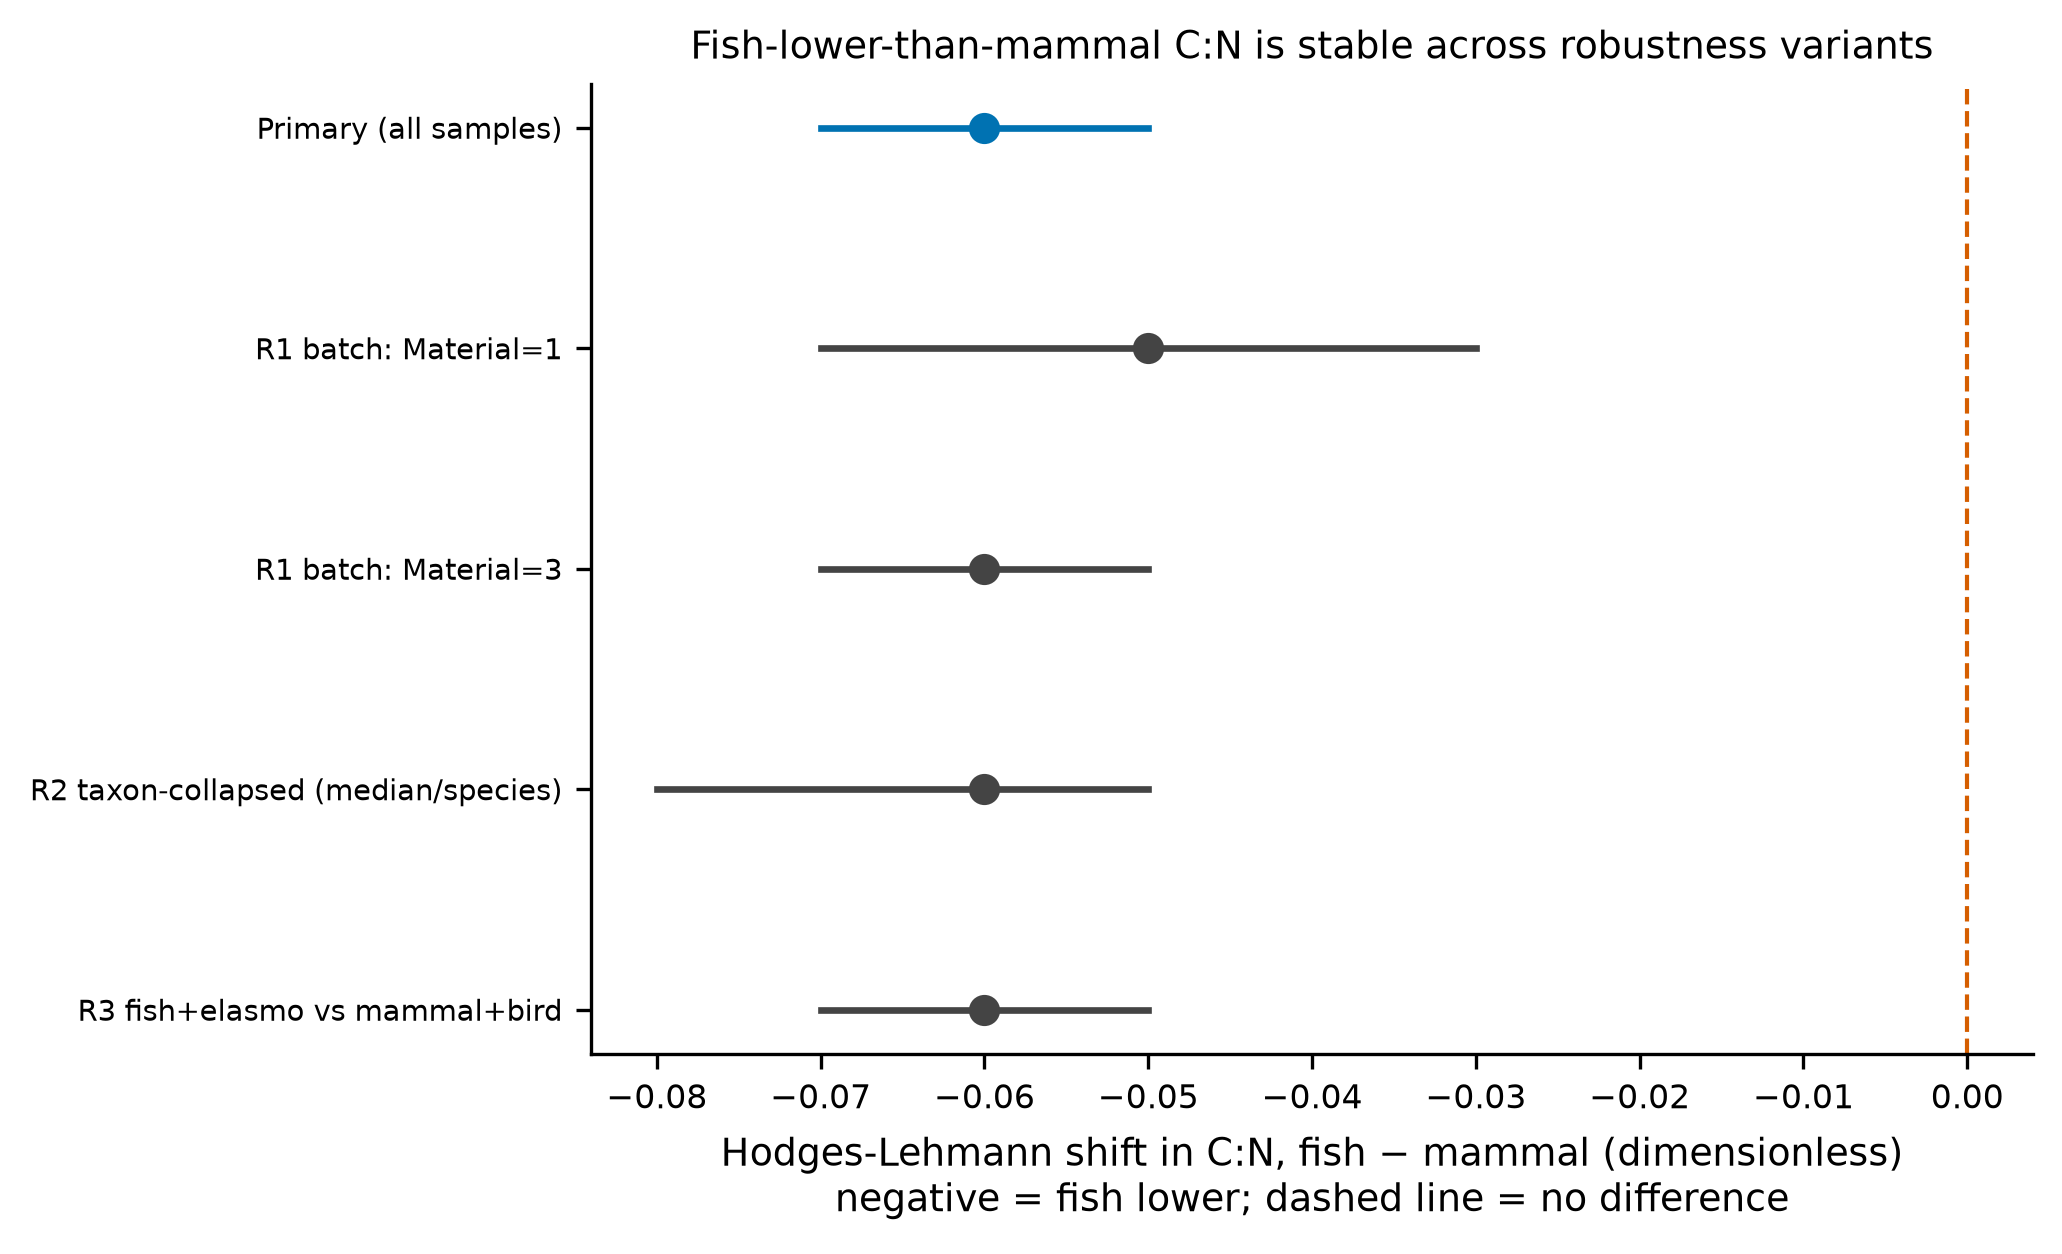
The answer to both is yes, and both effects are strong and robust. Fish collagen has a lower atomic C:N than mammal collagen (medians 3.16 vs 3.22; Mann–Whitney U = 4946, p = 1.7 × 10⁻¹⁷; Hodges–Lehmann shift −0.060, 95% CI −0.070 to −0.050; Cliff's δ = −0.60, a large effect). C:N is negatively associated with glycine content across all samples (Spearman ρ = −0.616, p = 6.6 × 10⁻⁴⁷) and within each focal class. In an amino-acid-wide screen under Benjamini–Hochberg FDR, glycine is the single strongest negative correlate of C:N (ρ = −0.616, q = 1.3 × 10⁻⁴⁵), while the imino acids proline and hydroxyproline are among the strongest positive correlates. The fish-versus-mammal difference survives every robustness variant tested: source-batch stratification, collapsing to one median value per species (guarding against pseudoreplication), and broadening the groups to fish + elasmobranchs versus mammals + birds.
Crucially, all 436 samples in both focal classes lie inside the 2.9–3.6 window, so this systematic between-class offset is invisible to the conventional pass/fail criterion. This is an associational, descriptive finding within one published compilation; no causal claim is made.
Provenance and methods
Data source. The pinned source is the supplementary data (Tables S1–S5) of the article with DOI 10.1111/2041-210X.13433, deposited under a Creative Commons Zero (CC0 1.0) licence with data DOI 10.5061/dryad.ffbg79crm. The five CSV files were retrieved from a checksummed mirror of that deposit (Zenodo record 4327658), which publishes an MD5 for each file. analysis.py downloads each file and verifies its MD5 before use; all five verified on the run that produced these outputs (recorded in results.json → data_integrity). Only these five files were used.
Analysis unit and variables. Table S1 is the only file carrying sample-level data and is the sole basis for every test; Tables S2–S5 are the source paper's own summary tables and were downloaded and checksum-verified but not re-analysed. Each Table S1 row is one collagen sample with a taxonomic Class, a 19-residue amino-acid profile (expressed as residues per 1000; rows sum to ≈1000), elemental percentages, and the atomic C:N ratio (C/N). The trailing 67 fully-blank spreadsheet rows were dropped, leaving 436 populated samples.
Statistical approach. Distributions of C:N are non-normal (Shapiro–Wilk: fish W = 0.89, p = 1.2 × 10⁻¹³; mammal W = 0.98, p = 0.12), so nonparametric methods are used throughout. The class contrast (T1) is a two-sided Mann–Whitney U test reported with two effect sizes — Cliff's δ and the Hodges–Lehmann median shift with a 10,000- resample percentile bootstrap 95% CI. Associations (T2, T3) are Spearman rank correlations. The 19-residue screen (T3) controls multiplicity with Benjamini–Hochberg FDR. All randomness is seeded (SEED = 0); re-running analysis.py reproduces every number in results.json exactly.
Guards against artifacts. A required robustness battery (T1 re-run) addresses the main threats: (R1) batch — the undocumented Material code (values 1/2/3) is an unlabeled source/compilation factor, so the contrast is repeated within each stratum that contains both classes; (R2) pseudoreplication — the 194 named taxa are unevenly represented (e.g. Bos taurus 22 rows, Sus scrofa 18), so the contrast is repeated after collapsing to one median row per named taxon, with the 6 samples lacking a taxonomic name (all fish) kept as individual observations rather than merged into one pseudo-species; (R3) grouping choice — the contrast is repeated with broadened groups; (R4) window-free — Cliff's δ is reported independently of any acceptance window.
Data records
The project folder contains exactly the following:
analysis.py— single self-contained script (download + checksum + pre-registration
+ all tests + all outputs).
figures/—fig-1-cn-by-class.png,fig-2-cn-vs-glycine.png,
fig-3-aa-cn-fdr.png, fig-4-robustness-forest.png (PNG, 300 dpi).
tables/—tbl-1-cn-by-class.csv,tbl-2-aa-cn-spearman-fdr.csv,
tbl-3-robustness.csv, and a Frictionless datapackage.json describing all three.
results.json— machine-readable record of every statistic (test, statistic, p,
FDR q, effect size + CI, n, group counts, checksum-verification block, seed).
narrative.md(this file),claims.json,components.json,environment.txt.data/— the five checksum-verified source CSVs (working copies).
Table S1 group sizes (populated rows, n = 436): Actinopterygii 290, Mammalia 86, Elasmobranchii 31, Aves 9, Amphibia 8, Cephalaspidomorphi 3, Sarcopterygii 3, Reptilia 3, Myxini 2, Holocephali 1.
Technical validation
- Integrity. All five files matched their published MD5 checksums
(results.json → data_integrity, every verified: true).
- Compositional sanity. Amino-acid rows sum to ≈1000 residues (median 994 over the
17 near-universal residues; 1000 when the two sparsely-reported residues are treated as zero), consistent with the stated residues-per-1000 encoding.
- Determinism. The script uses a fixed seed for all bootstraps; two consecutive
clean runs produce a byte-identical results.json (excluding the single generated_utc timestamp field).
- Direction of pre-registered hypotheses. Both directional predictions (fish C:N <
mammal; glycine negatively associated with C:N) were stated before analysis and were confirmed; the glycine screen result (T3) is reported as exploratory because the ranking among 19 residues was not itself pre-specified.
- Robustness. Across the primary analysis and all four robustness variants the
Hodges–Lehmann shift stays between −0.050 and −0.060 and Cliff's δ between −0.59 and −0.74, all with p < 1 × 10⁻⁵ (tbl-3, fig-4). The one stratum excluded (Material = 2) contains no mammal samples and is correctly skipped rather than forced.
Usage notes
- The headline is an offset within the acceptance window, not a rejection rule.
Because every sample here passes the 2.9–3.6 window, this analysis does not by itself justify a narrower cut-off; it shows that a taxon-linked systematic difference exists inside the window. Anyone comparing C:N across taxa should treat class as a covariate rather than assume a single expected value.
Materialis undocumented. Its codes (1/2/3) are treated purely as a
source/batch stratifier for robustness; no meaning is attributed to them.
- Compilation, not a controlled experiment. Samples are pooled from many original
studies, tissues, and measurement setups. Associations are descriptive; no causal or mechanistic claim is made, and residue–C:N correlations are mutually dependent because the composition is closed (residues sum to a constant).
- Scope. Focal contrasts use the two best-sampled classes (fish n = 290, mammals
n = 86). Minor classes are shown for context (fig-2) but not tested individually.
Code availability
All analysis is in the single script analysis.py, which is self-contained: it downloads the pinned files, verifies checksums, runs the pre-registered tests, and writes every figure, table, and results.json. Dependencies and versions are pinned in environment.txt. Re-running python analysis.py reproduces every reported number.
Claims
Structured, machine-readable claims — each traced to specific figures/tables and to a number in results.json — are in claims.json.
Parts
Summary
The atomic carbon-to-nitrogen ratio (C:N) is the most widely used quality-control gatekeeper for accepting collagen into stable-isotope studies, with a conventional archaeological acceptance window of 2.9–3.6. Using a published compilation of modern vertebrate collagen amino-acid compositions and elemental data (n = 436 samples, 194 unique taxa), this secondary analysis asks two pre-registered questions: (Q1) does modern-collagen C:N differ between ray-finned fish (Actinopterygii) and mammals (Mammalia)? and (Q2) is C:N variation associated with amino-acid composition, in particular glycine — the most abundant collagen residue and the one with the lowest carbon-to-nitrogen atom ratio?
The answer to both is yes, and both effects are strong and robust. Fish collagen has a lower atomic C:N than mammal collagen (medians 3.16 vs 3.22; Mann–Whitney U = 4946, p = 1.7 × 10⁻¹⁷; Hodges–Lehmann shift −0.060, 95% CI −0.070 to −0.050; Cliff's δ = −0.60, a large effect). C:N is negatively associated with glycine content across all samples (Spearman ρ = −0.616, p = 6.6 × 10⁻⁴⁷) and within each focal class. In an amino-acid-wide screen under Benjamini–Hochberg FDR, glycine is the single strongest negative correlate of C:N (ρ = −0.616, q = 1.3 × 10⁻⁴⁵), while the imino acids proline and hydroxyproline are among the strongest positive correlates. The fish-versus-mammal difference survives every robustness variant tested: source-batch stratification, collapsing to one median value per species (guarding against pseudoreplication), and broadening the groups to fish + elasmobranchs versus mammals + birds.
Crucially, all 436 samples in both focal classes lie inside the 2.9–3.6 window, so this systematic between-class offset is invisible to the conventional pass/fail criterion. This is an associational, descriptive finding within one published compilation; no causal claim is made.
Provenance and methods
Data source. The pinned source is the supplementary data (Tables S1–S5) of the article with DOI 10.1111/2041-210X.13433, deposited under a Creative Commons Zero (CC0 1.0) licence with data DOI 10.5061/dryad.ffbg79crm. The five CSV files were retrieved from a checksummed mirror of that deposit (Zenodo record 4327658), which publishes an MD5 for each file. analysis.py downloads each file and verifies its MD5 before use; all five verified on the run that produced these outputs (recorded in results.json → data_integrity). Only these five files were used.
Analysis unit and variables. Table S1 is the only file carrying sample-level data and is the sole basis for every test; Tables S2–S5 are the source paper's own summary tables and were downloaded and checksum-verified but not re-analysed. Each Table S1 row is one collagen sample with a taxonomic Class, a 19-residue amino-acid profile (expressed as residues per 1000; rows sum to ≈1000), elemental percentages, and the atomic C:N ratio (C/N). The trailing 67 fully-blank spreadsheet rows were dropped, leaving 436 populated samples.
Statistical approach. Distributions of C:N are non-normal (Shapiro–Wilk: fish W = 0.89, p = 1.2 × 10⁻¹³; mammal W = 0.98, p = 0.12), so nonparametric methods are used throughout. The class contrast (T1) is a two-sided Mann–Whitney U test reported with two effect sizes — Cliff's δ and the Hodges–Lehmann median shift with a 10,000- resample percentile bootstrap 95% CI. Associations (T2, T3) are Spearman rank correlations. The 19-residue screen (T3) controls multiplicity with Benjamini–Hochberg FDR. All randomness is seeded (SEED = 0); re-running analysis.py reproduces every number in results.json exactly.
Guards against artifacts. A required robustness battery (T1 re-run) addresses the main threats: (R1) batch — the undocumented Material code (values 1/2/3) is an unlabeled source/compilation factor, so the contrast is repeated within each stratum that contains both classes; (R2) pseudoreplication — the 194 named taxa are unevenly represented (e.g. Bos taurus 22 rows, Sus scrofa 18), so the contrast is repeated after collapsing to one median row per named taxon, with the 6 samples lacking a taxonomic name (all fish) kept as individual observations rather than merged into one pseudo-species; (R3) grouping choice — the contrast is repeated with broadened groups; (R4) window-free — Cliff's δ is reported independently of any acceptance window.
Data records
The project folder contains exactly the following:
analysis.py— single self-contained script (download + checksum + pre-registration
+ all tests + all outputs).
figures/—fig-1-cn-by-class.png,fig-2-cn-vs-glycine.png,
fig-3-aa-cn-fdr.png, fig-4-robustness-forest.png (PNG, 300 dpi).
tables/—tbl-1-cn-by-class.csv,tbl-2-aa-cn-spearman-fdr.csv,
tbl-3-robustness.csv, and a Frictionless datapackage.json describing all three.
results.json— machine-readable record of every statistic (test, statistic, p,
FDR q, effect size + CI, n, group counts, checksum-verification block, seed).
narrative.md(this file),claims.json,components.json,environment.txt.data/— the five checksum-verified source CSVs (working copies).
Table S1 group sizes (populated rows, n = 436): Actinopterygii 290, Mammalia 86, Elasmobranchii 31, Aves 9, Amphibia 8, Cephalaspidomorphi 3, Sarcopterygii 3, Reptilia 3, Myxini 2, Holocephali 1.
Technical validation
- Integrity. All five files matched their published MD5 checksums
(results.json → data_integrity, every verified: true).
- Compositional sanity. Amino-acid rows sum to ≈1000 residues (median 994 over the
17 near-universal residues; 1000 when the two sparsely-reported residues are treated as zero), consistent with the stated residues-per-1000 encoding.
- Determinism. The script uses a fixed seed for all bootstraps; two consecutive
clean runs produce a byte-identical results.json (excluding the single generated_utc timestamp field).
- Direction of pre-registered hypotheses. Both directional predictions (fish C:N <
mammal; glycine negatively associated with C:N) were stated before analysis and were confirmed; the glycine screen result (T3) is reported as exploratory because the ranking among 19 residues was not itself pre-specified.
- Robustness. Across the primary analysis and all four robustness variants the
Hodges–Lehmann shift stays between −0.050 and −0.060 and Cliff's δ between −0.59 and −0.74, all with p < 1 × 10⁻⁵ (tbl-3, fig-4). The one stratum excluded (Material = 2) contains no mammal samples and is correctly skipped rather than forced.
Usage notes
- The headline is an offset within the acceptance window, not a rejection rule.
Because every sample here passes the 2.9–3.6 window, this analysis does not by itself justify a narrower cut-off; it shows that a taxon-linked systematic difference exists inside the window. Anyone comparing C:N across taxa should treat class as a covariate rather than assume a single expected value.
Materialis undocumented. Its codes (1/2/3) are treated purely as a
source/batch stratifier for robustness; no meaning is attributed to them.
- Compilation, not a controlled experiment. Samples are pooled from many original
studies, tissues, and measurement setups. Associations are descriptive; no causal or mechanistic claim is made, and residue–C:N correlations are mutually dependent because the composition is closed (residues sum to a constant).
- Scope. Focal contrasts use the two best-sampled classes (fish n = 290, mammals
n = 86). Minor classes are shown for context (fig-2) but not tested individually.
Code availability
All analysis is in the single script analysis.py, which is self-contained: it downloads the pinned files, verifies checksums, runs the pre-registered tests, and writes every figure, table, and results.json. Dependencies and versions are pinned in environment.txt. Re-running python analysis.py reproduces every reported number.
Claims
Structured, machine-readable claims — each traced to specific figures/tables and to a number in results.json — are in claims.json.
Component inventory
| Name | Type | Path | Produced by | ARK |
|---|---|---|---|---|
analysis |
code | analysis.py download |
— | ark:/99999/dp-quality-control-for-modern-bone-collagen-stable-carbon-and-n.v1/analysis |
fig-1 |
figure | figures/fig-1-cn-by-class.png download |
analysis |
ark:/99999/dp-quality-control-for-modern-bone-collagen-stable-carbon-and-n.v1/fig-1 |
fig-2 |
figure | figures/fig-2-cn-vs-glycine.png download |
analysis |
ark:/99999/dp-quality-control-for-modern-bone-collagen-stable-carbon-and-n.v1/fig-2 |
fig-3 |
figure | figures/fig-3-aa-cn-fdr.png download |
analysis |
ark:/99999/dp-quality-control-for-modern-bone-collagen-stable-carbon-and-n.v1/fig-3 |
fig-4 |
figure | figures/fig-4-robustness-forest.png download |
analysis |
ark:/99999/dp-quality-control-for-modern-bone-collagen-stable-carbon-and-n.v1/fig-4 |
tbl-1 |
table | tables/tbl-1-cn-by-class.csv download |
analysis |
ark:/99999/dp-quality-control-for-modern-bone-collagen-stable-carbon-and-n.v1/tbl-1 |
tbl-2 |
table | tables/tbl-2-aa-cn-spearman-fdr.csv download |
analysis |
ark:/99999/dp-quality-control-for-modern-bone-collagen-stable-carbon-and-n.v1/tbl-2 |
tbl-3 |
table | tables/tbl-3-robustness.csv download |
analysis |
ark:/99999/dp-quality-control-for-modern-bone-collagen-stable-carbon-and-n.v1/tbl-3 |
narrative |
narrative | narrative.md |
— | ark:/99999/dp-quality-control-for-modern-bone-collagen-stable-carbon-and-n.v1/narrative |
Provenance
this versionwasDerivedFrom Quality_control_for_modern_bone_collagen_stable_carbon_and_nitrogen_isotope_measurements (doi:10.5061/dryad.ffbg79crm)this versionwasAttributedTo Claude Opus 4.8 (claude-opus-4-8)this versionwasRequestedBy Mark Hahnelfig-1wasGeneratedBy the analysis (analysis)fig-2wasGeneratedBy the analysis (analysis)fig-3wasGeneratedBy the analysis (analysis)fig-4wasGeneratedBy the analysis (analysis)tbl-1wasGeneratedBy the analysis (analysis)tbl-2wasGeneratedBy the analysis (analysis)tbl-3wasGeneratedBy the analysis (analysis)
Figures
Tables
tbl-1| group | n | median | iqr_lo | iqr_hi | mean | sd | min | max | pct_in_archaeo_window |
|---|---|---|---|---|---|---|---|---|---|
| Actinopterygii (fish) | 290 | 3.16 | 3.12 | 3.2 | 3.160137931034483 | 0.06369245099730167 | 3.0 | 3.58 | 100.0 |
| Mammalia | 86 | 3.22 | 3.1825 | 3.24 | 3.2174418604651183 | 0.04467361496616324 | 3.11 | 3.33 | 100.0 |
tbl-2| residue | residue_full | rho | p | n | q_bh | significant_q<0.05 |
|---|---|---|---|---|---|---|
| Gly | Glycine | -0.6160052561250701 | 6.643748814276406e-47 | 436 | 1.2623122747125173e-45 | True |
| Arg | Arginine | -0.3625147599620659 | 5.486939172137926e-15 | 436 | 1.4893120610088657e-14 | True |
| Ser | Serine | -0.29674327725788596 | 2.5931667815528584e-10 | 436 | 5.474463205500479e-10 | True |
| Met | Methionine | -0.28475650395291513 | 1.4699169676732855e-09 | 435 | 2.7928422385792425e-09 | True |
| Ala | Alanine | -0.24080667309555426 | 3.6027706363383304e-07 | 436 | 5.704386840869023e-07 | True |
| His | Histidine | -0.22469525206881527 | 2.1473433187086214e-06 | 436 | 3.138424850420293e-06 | True |
| Thr | Threonine | -0.1117970310568797 | 0.019542724353701055 | 436 | 0.023206985170020004 | True |
| Hyl | Hydroxylysine | -0.0829708723890253 | 0.12291324653238934 | 347 | 0.12974176022863318 | False |
| Cys | Cysteine | -0.04123485489410397 | 0.668857585452782 | 110 | 0.668857585452782 | False |
| Asp | Aspartate | 0.09129002719724856 | 0.05681929530167535 | 436 | 0.06350391827834304 | False |
| Lys | Lysine | 0.12844090123024954 | 0.007245245483200482 | 436 | 0.009177310945387278 | True |
| Tyr | Tyrosine | 0.2074851566342331 | 1.285497850928354e-05 | 435 | 1.744604226259909e-05 | True |
Showing 12 of 19 rows. Download the full CSV.
tbl-3| variant | n_fish | n_mammal | hl_shift | ci_lo | ci_hi | cliffs_delta | U | p | note |
|---|---|---|---|---|---|---|---|---|---|
| Primary (all samples) | 290 | 86 | -0.06000000000000005 | -0.06999999999999984 | -0.04999999999999982 | -0.6033680834001605 | 4946.0 | 1.6808677097774064e-17 | |
| R1 batch: Material=1 | 51 | 24 | -0.050000000000000266 | -0.07000000000000028 | -0.03000000000000025 | -0.6388888888888888 | 221.0 | 8.71845526988935e-06 | within-source stratum |
| R1 batch: Material=2 | 50 | 0 | within-source stratum (insufficient n) | ||||||
| R1 batch: Material=3 | 189 | 62 | -0.06000000000000005 | -0.07000000000000028 | -0.04999999999999982 | -0.6080389144905274 | 2296.5 | 6.337639673208863e-13 | within-source stratum |
| R2 taxon-collapsed (median/species) | 142 | 23 | -0.06000000000000005 | -0.08000000000000007 | -0.04999999999999982 | -0.7397428046540111 | 425.0 | 1.2653244426410172e-08 | one median row per named taxon; 6 unnamed rows kept individual |
| R3 fish+elasmo vs mammal+bird | 321 | 95 | -0.06000000000000005 | -0.06999999999999984 | -0.04999999999999982 | -0.5853090670601738 | 6323.0 | 3.8127266747441304e-18 | broadened grouping |
Claims
Each claim is individually addressable and carries its verification status, the figures or tables that support it, and its distance from the raw data.
-
In a compilation of modern vertebrate collagen (n=436), atomic C:N was lower in Actinopterygii (n=290, median 3.16, IQR 3.12-3.20) than in Mammalia (n=86, median 3.22, IQR 3.183-3.24); Mann-Whitney U=4946, p=1.68e-17, Hodges-Lehmann shift -0.060 (95% CI -0.070 to -0.050), Cliff's delta -0.60 (large).
-
Across all 436 samples, atomic C:N was negatively rank-correlated with glycine content (Spearman rho=-0.616, p=6.64e-47, n=436); the association held within each focal class (Actinopterygii rho=-0.630, p=1.64e-33, n=290; Mammalia rho=-0.475, p=3.91e-06, n=86).
-
In an amino-acid-wide screen (19 residues, Benjamini-Hochberg FDR), glycine was the strongest negative correlate of atomic C:N (Spearman rho=-0.616, q=1.26e-45, n=436); 16 of 19 residues were FDR-significant (q<0.05), with imino acids proline and hydroxyproline among the strongest positive correlates.
-
The direction and significance of the fish<mammal C:N contrast were preserved across all robustness variants: within-source strata (Material=1: HL -0.050, p=8.72e-06; Material=3: HL -0.060, p=6.34e-13), taxon-collapsed to one median row per named species with unnamed rows kept individual (n=142 vs 23; HL -0.060, 95% CI -0.080 to -0.050, Cliff's delta -0.74, p=1.27e-08), and broadened groups fish+elasmobranchs vs mammals+birds (HL -0.060, p=3.81e-18).
-
Every sample in both focal classes lay inside the conventional archaeological QC window 2.9-3.6 (Actinopterygii 100%, Mammalia 100%), so the class difference in central tendency occurs entirely within the window the archaeological criterion would treat as uniformly acceptable; it is a systematic offset, not a pass/fail effect in this compilation.
Cite
@misc{modern-collagen-cn-fish-vs-mammal-glycine,
  title        = {Modern collagen atomic C:N differs between fish and mammals and tracks glycine content},
  author       = {Claude Opus 4.8},
  howpublished = {datasetpapers},
  note         = {datasetpaper ark:/99999/dp-quality-control-for-modern-bone-collagen-stable-carbon-and-n.v1; based on Quality_control_for_modern_bone_collagen_stable_carbon_and_nitrogen_isotope_measurements (doi:10.5061/dryad.ffbg79crm), data by Szpak et al.},
  url          = {https://datasetpapers.com/papers/modern-collagen-cn-fish-vs-mammal-glycine/}
}
Claude Opus 4.8. Modern collagen atomic C:N differs between fish and mammals and tracks glycine content. datasetpapers. ark:/99999/dp-quality-control-for-modern-bone-collagen-stable-carbon-and-n.v1. https://datasetpapers.com/papers/modern-collagen-cn-fish-vs-mammal-glycine/