
Datasetpaper · global health / diagnostics (target product profiles)
Structured characterization of malaria diagnostic Target Product Profile requirements across two use-cases
Data story Read the interactive, evidence-linked version of this paper →Paper is a compiled reading view, rendered from the underlying research object (an RO-Crate) — not hand-edited. Object shows that same object taken apart: its individually addressable components, their provenance, and the machine-readable exports agents can fetch directly. Switch above.
- Version
ark:/99999/dp-target-product-profiles-for-malaria-diagnostics.v1- Concept
ark:/99999/dp-target-product-profiles-for-malaria-diagnostics- Source dataset
- Target product profiles for malaria diagnostics.
Summary
This work profiles a single published supplementary table that specifies target product profiles (TPPs) — the required performance and operational criteria — for malaria diagnostic tests, and asks one pre-registered question: do the two intended use-cases differ in how they prioritise diagnostic requirements? The table defines requirements for two use-cases, Case Management in Elimination Settings and Screening/Surveillance (District Level or Below), across 23 substantive criteria grouped into two sections (technical specifications; health-systems and technical specifications). Each requirement cell is annotated with priority tiers: E (Essential), D (Desirable), or O (Optional).
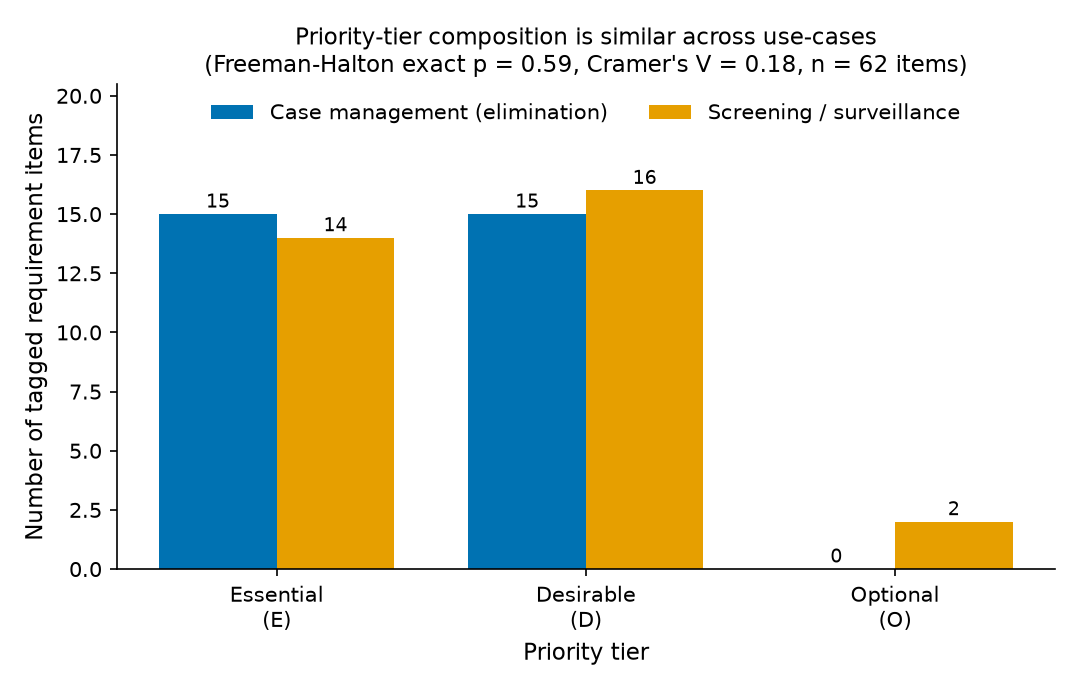
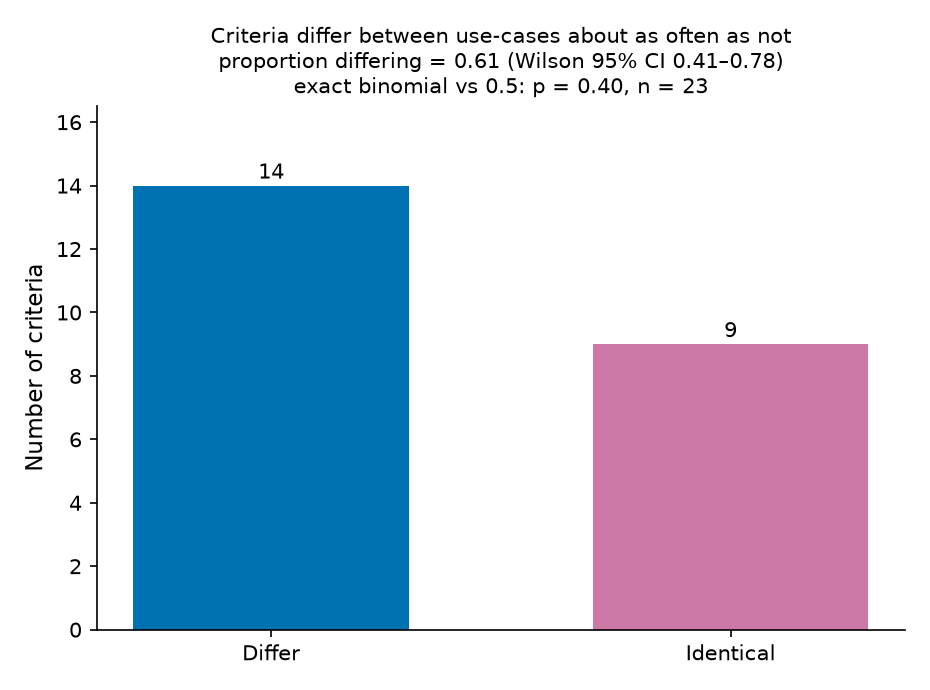
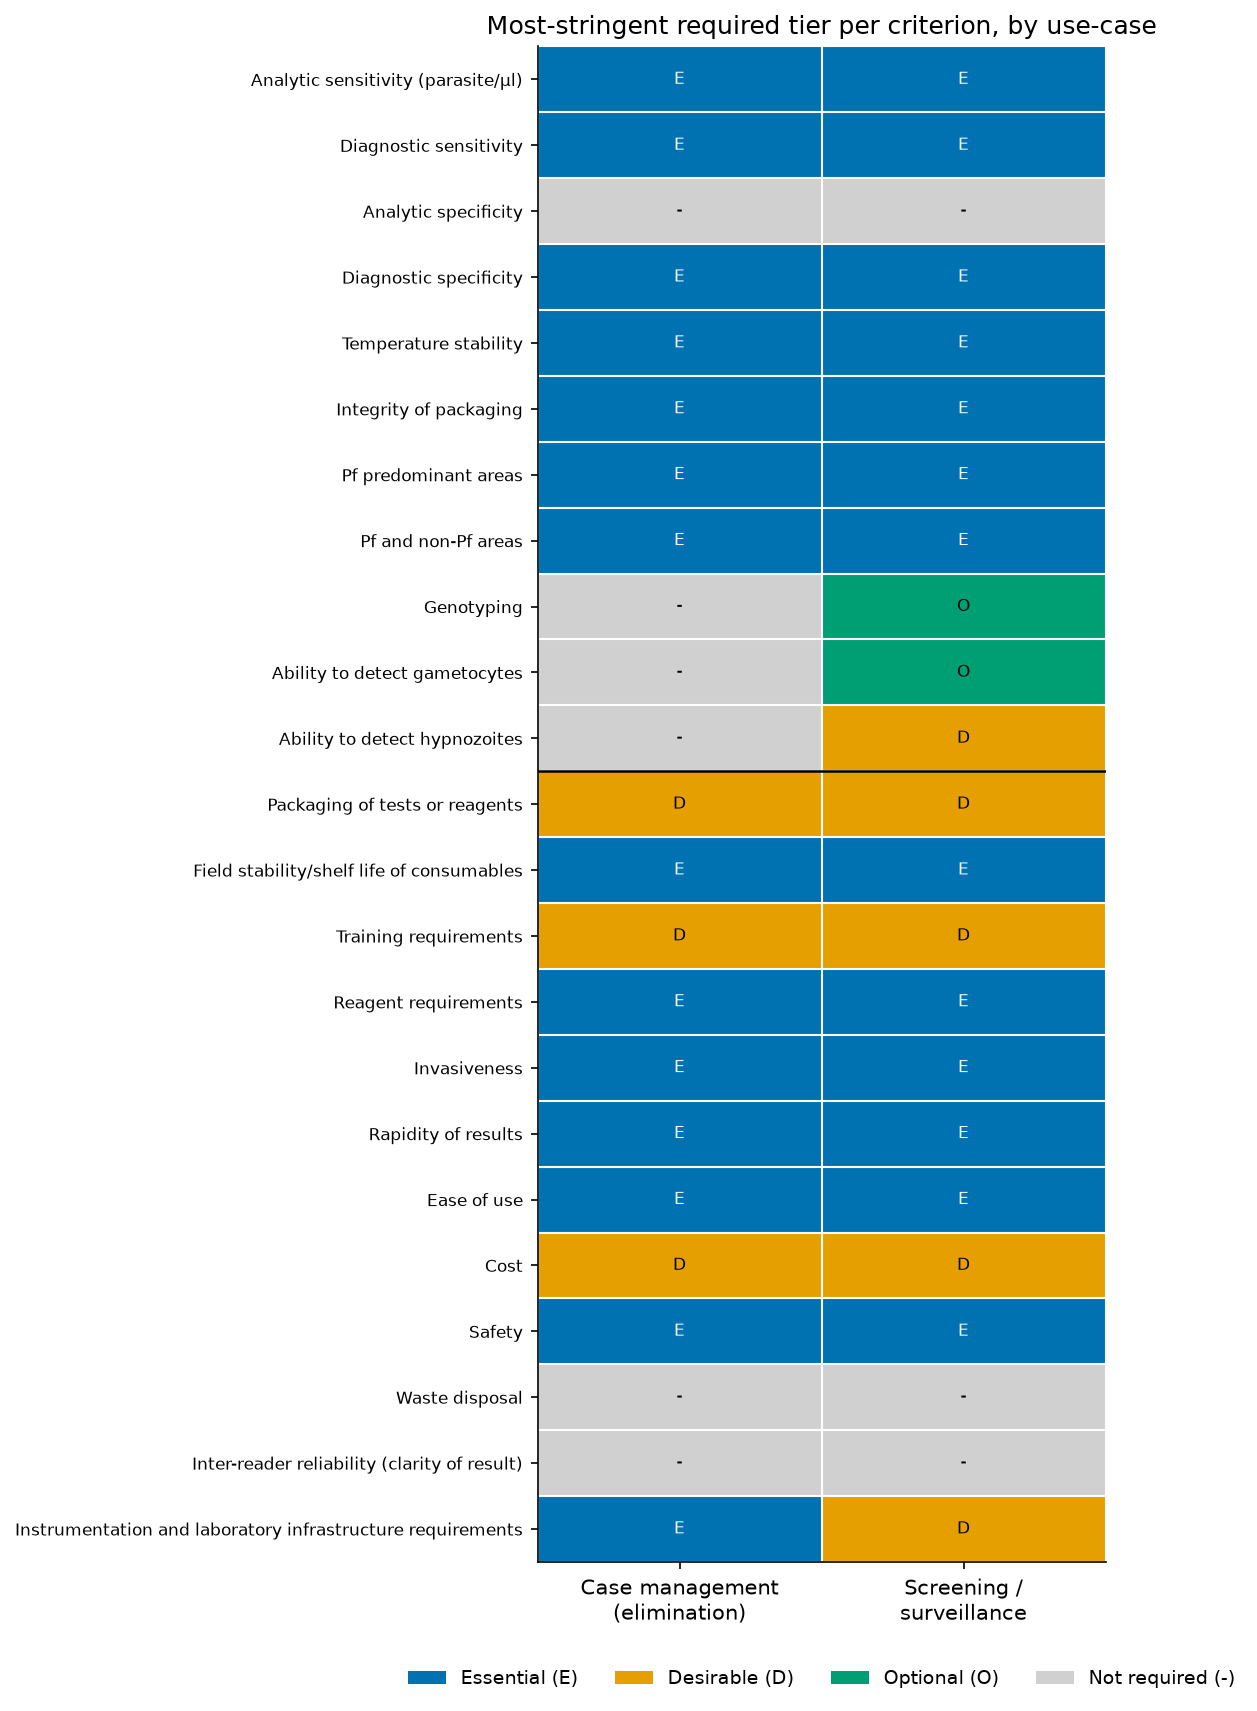
The dataset is small and deterministic, so the analysis is primarily a rigorous, fully reproducible descriptive characterization, accompanied by two pre-registered exact tests carried out with explicit small-sample caveats. The two use-cases have near-identical priority-tier composition (Freeman–Halton exact p = 0.59; Cramér's V = 0.18; n = 62 tagged items) and their per-criterion requirements are identical for 9 of 23 criteria and differ in wording for 14 of 23 (proportion differing 0.61, Wilson 95% CI 0.41–0.78; exact binomial vs 0.5 p = 0.40). After Holm–Bonferroni correction across the two primary tests, both corrected p-values are 0.81. Neither test provides evidence of a systematic difference between use-cases. The substantive difference is narrow and localized: on the ordinal stringency scale, the two use-cases assign the same most-stringent tier on 19 of 23 criteria; the surveillance use-case is more stringent on 3 criteria (all parasite-stage/genotype detection: genotyping, gametocyte detection, hypnozoite detection) and the case-management use-case is more stringent on 1 (instrumentation and laboratory infrastructure). These are reported as descriptive counts, not as tested hypotheses, and no causal interpretation is made.
Provenance and methods
Source. Supplementary Table 1, "Target product profiles for malaria diagnostics", from the malaria eradication research agenda (malERA) consultative group on diagnoses and diagnostics. DOI 10.1371/journal.pmed.1000396.t001. Licence: CC BY 4.0. The source file is a single-sheet legacy Excel workbook (Table_1.xls, 9728 bytes, md5 2bbf6174e03e39ce858e4fcdc0ad287f).
Acquisition. analysis.py first attempts to download the canonical file from the publisher's file host (https://ndownloader.figshare.com/files/803775) and verifies its md5. If the download is unavailable, it falls back to a local copy and re-verifies the md5 against the expected checksum; a checksum mismatch is a hard failure. The reported run used the md5-verified local copy because the canonical host was not reachable from the analysis environment; the checksum matched exactly, so the file is byte-identical to the canonical source.
Parsing. The workbook cells contain embedded HTML (<b>, <sup>, <a>). Section-header rows (bold text with empty data columns) are separated from substantive criterion rows. Footnote superscripts and all HTML tags are stripped. Priority tiers are extracted with a regular expression that matches standalone E, D, or O tokens (word-boundary–guarded so letters inside words are not captured). The parser recovers 23 substantive criteria and 2 top-level sections; a non-bold sub-label row ("Species detection/differentiation:") is treated as a heading, not data.
Pre-registered question. Do the two use-cases differ in (a) the overall composition of priority tiers assigned, and (b) the specific per-criterion requirements?
Pre-registered Test 1 — priority-tier composition. Unit = each tagged requirement item. A 2 × 3 contingency table (use-case × {E, D, O}) is tested with the Freeman–Halton exact test (the r × c generalization of Fisher's exact test), chosen because several expected cell counts are below 5, which makes the chi-square approximation unreliable. The chi-square statistic and p are reported for reference only. Effect size: Cramér's V. Sensitivity check: recompute on presence/absence per criterion (each criterion contributes at most one count per tier) to remove within-cell pseudoreplication.
Pre-registered Test 2 — cross-use-case concordance. For each of the 23 criteria, the two use-case cells are classified as identical or differing (exact HTML-stripped text). An exact binomial test compares the proportion differing to 0.5; effect size is the proportion with a Wilson 95% confidence interval. Sensitivity check: repeat under a normalized comparison (lower-cased, punctuation and whitespace collapsed) to confirm the count is not an artifact of formatting.
Multiple comparisons. The two primary p-values are corrected together with the Holm–Bonferroni method.
Discipline. Nonparametric/exact tests throughout; effect sizes and n reported for every test; a fixed random seed (20240517) is set although no procedure is stochastic; null and weak results are reported as such; no causal claims are made.
Data records
The analysis emits, alongside results.json (every statistic) and this narrative:
tables/tbl-1-tier-counts.csv— 2 × 3 counts of tagged requirement items (E/D/O) by use-case.tables/tbl-2-criterion-concordance.csv— for each of the 23 criteria: section, criterion, both use-case requirement texts, and identical/differing flags (raw and normalized).tables/tbl-3-requirement-map.csv— the tidy requirement map: most-stringent tier and its ordinal stringency (3=Essential, 2=Desirable, 1=Optional, 0=Not required) per criterion per use-case.tables/datapackage.json— a Frictionless data package describing each CSV (field names, types), the source DOI, and the CC BY 4.0 licence.figures/fig-1-tier-composition.png— grouped bar chart of tier composition by use-case with Test 1 statistics in the title.figures/fig-2-concordance.png— identical-vs-differing criterion counts with Test 2 statistics in the title.figures/fig-3-requirement-map.png— colour-coded matrix of the most-stringent required tier for all 23 criteria × 2 use-cases, grouped by section.
Technical validation
Checksum. The source file's md5 is verified against 2bbf6174e03e39ce858e4fcdc0ad287f before parsing; the pipeline refuses to run on a mismatch.
Parse validation. The tier extractor recovers 29 E, 31 D, and 2 O tokens across both columns, consistent with a manual read of the table. Section assignment yields 11 technical-specification criteria and 12 health-systems criteria (23 total), matching the source layout.
Determinism. Running analysis.py twice produces byte-identical statistics in results.json (excluding the generation timestamp). All reported numbers are therefore exactly reproducible.
Robustness. Both pre-registered tests are accompanied by a sensitivity analysis. Test 1 is stable: presence/absence recomputation gives exact p = 0.58 and Cramér's V = 0.19, essentially unchanged from the item-level p = 0.59 and V = 0.18. Test 2 is stable: the normalized-text comparison gives the identical count (14 of 23 differing), so the concordance result is not a formatting artifact.
Honest reporting of limits. With 23 criteria and only two columns, the table is far too small for inferential modelling; the exact tests are underpowered by construction and their non-significant results should not be read as evidence of equivalence. The descriptive requirement map (Test 3 / fig-3) is the substantive core of this work; the two inferential tests are reported for completeness and to bound the comparison, not to support a positive claim.
Usage notes
The requirement map (tbl-3 / fig-3) is the most directly useful artifact: it shows at a glance which diagnostic criteria are Essential in both use-cases (the majority of technical and health-systems criteria), which are relaxed to Desirable in both (packaging, training, cost), and where the two use-cases genuinely diverge. The divergences are interpretable in domain terms: surveillance-oriented testing places positive value on detecting transmission-relevant parasite stages and genotypes (gametocytes, hypnozoites, genotyping) that case-management-in-elimination testing does not require, while case management places a stricter requirement on being usable without external instrumentation. These observations describe the published profile; they are not empirical findings about test performance and imply nothing causal.
Anyone reusing these tables should retain the CC BY 4.0 attribution to the original malERA source (DOI above).
Code availability
All analysis is contained in a single self-contained script, analysis.py, which acquires and checksum-verifies the source, runs the pre-registered tests and sensitivity checks, and writes every figure, table, and results.json. The Python version and full dependency list are recorded in environment.txt. Re-running the script reproduces every number reported here.
Claims
See claims.json for the machine-readable claim set. In brief:
1. The two use-cases do not differ significantly in priority-tier composition (Freeman–Halton exact p = 0.59, Holm-corrected 0.81; Cramér's V = 0.18; n = 62 items) — a null result. 2. Per-criterion requirements are identical for 9 of 23 criteria and differ for 14 of 23 (proportion 0.61, Wilson 95% CI 0.41–0.78; exact binomial vs 0.5 p = 0.40, Holm-corrected 0.81) — the proportion differing is not distinguishable from one-half. 3. Descriptively, the two use-cases assign the same most-stringent tier on 19 of 23 criteria; stringency differs on 4 criteria (3 more stringent for surveillance, 1 for case management), all in interpretable, domain-specific directions.
Parts
Summary
This work profiles a single published supplementary table that specifies target product profiles (TPPs) — the required performance and operational criteria — for malaria diagnostic tests, and asks one pre-registered question: do the two intended use-cases differ in how they prioritise diagnostic requirements? The table defines requirements for two use-cases, Case Management in Elimination Settings and Screening/Surveillance (District Level or Below), across 23 substantive criteria grouped into two sections (technical specifications; health-systems and technical specifications). Each requirement cell is annotated with priority tiers: E (Essential), D (Desirable), or O (Optional).
The dataset is small and deterministic, so the analysis is primarily a rigorous, fully reproducible descriptive characterization, accompanied by two pre-registered exact tests carried out with explicit small-sample caveats. The two use-cases have near-identical priority-tier composition (Freeman–Halton exact p = 0.59; Cramér's V = 0.18; n = 62 tagged items) and their per-criterion requirements are identical for 9 of 23 criteria and differ in wording for 14 of 23 (proportion differing 0.61, Wilson 95% CI 0.41–0.78; exact binomial vs 0.5 p = 0.40). After Holm–Bonferroni correction across the two primary tests, both corrected p-values are 0.81. Neither test provides evidence of a systematic difference between use-cases. The substantive difference is narrow and localized: on the ordinal stringency scale, the two use-cases assign the same most-stringent tier on 19 of 23 criteria; the surveillance use-case is more stringent on 3 criteria (all parasite-stage/genotype detection: genotyping, gametocyte detection, hypnozoite detection) and the case-management use-case is more stringent on 1 (instrumentation and laboratory infrastructure). These are reported as descriptive counts, not as tested hypotheses, and no causal interpretation is made.
Provenance and methods
Source. Supplementary Table 1, "Target product profiles for malaria diagnostics", from the malaria eradication research agenda (malERA) consultative group on diagnoses and diagnostics. DOI 10.1371/journal.pmed.1000396.t001. Licence: CC BY 4.0. The source file is a single-sheet legacy Excel workbook (Table_1.xls, 9728 bytes, md5 2bbf6174e03e39ce858e4fcdc0ad287f).
Acquisition. analysis.py first attempts to download the canonical file from the publisher's file host (https://ndownloader.figshare.com/files/803775) and verifies its md5. If the download is unavailable, it falls back to a local copy and re-verifies the md5 against the expected checksum; a checksum mismatch is a hard failure. The reported run used the md5-verified local copy because the canonical host was not reachable from the analysis environment; the checksum matched exactly, so the file is byte-identical to the canonical source.
Parsing. The workbook cells contain embedded HTML (<b>, <sup>, <a>). Section-header rows (bold text with empty data columns) are separated from substantive criterion rows. Footnote superscripts and all HTML tags are stripped. Priority tiers are extracted with a regular expression that matches standalone E, D, or O tokens (word-boundary–guarded so letters inside words are not captured). The parser recovers 23 substantive criteria and 2 top-level sections; a non-bold sub-label row ("Species detection/differentiation:") is treated as a heading, not data.
Pre-registered question. Do the two use-cases differ in (a) the overall composition of priority tiers assigned, and (b) the specific per-criterion requirements?
Pre-registered Test 1 — priority-tier composition. Unit = each tagged requirement item. A 2 × 3 contingency table (use-case × {E, D, O}) is tested with the Freeman–Halton exact test (the r × c generalization of Fisher's exact test), chosen because several expected cell counts are below 5, which makes the chi-square approximation unreliable. The chi-square statistic and p are reported for reference only. Effect size: Cramér's V. Sensitivity check: recompute on presence/absence per criterion (each criterion contributes at most one count per tier) to remove within-cell pseudoreplication.
Pre-registered Test 2 — cross-use-case concordance. For each of the 23 criteria, the two use-case cells are classified as identical or differing (exact HTML-stripped text). An exact binomial test compares the proportion differing to 0.5; effect size is the proportion with a Wilson 95% confidence interval. Sensitivity check: repeat under a normalized comparison (lower-cased, punctuation and whitespace collapsed) to confirm the count is not an artifact of formatting.
Multiple comparisons. The two primary p-values are corrected together with the Holm–Bonferroni method.
Discipline. Nonparametric/exact tests throughout; effect sizes and n reported for every test; a fixed random seed (20240517) is set although no procedure is stochastic; null and weak results are reported as such; no causal claims are made.
Data records
The analysis emits, alongside results.json (every statistic) and this narrative:
tables/tbl-1-tier-counts.csv— 2 × 3 counts of tagged requirement items (E/D/O) by use-case.tables/tbl-2-criterion-concordance.csv— for each of the 23 criteria: section, criterion, both use-case requirement texts, and identical/differing flags (raw and normalized).tables/tbl-3-requirement-map.csv— the tidy requirement map: most-stringent tier and its ordinal stringency (3=Essential, 2=Desirable, 1=Optional, 0=Not required) per criterion per use-case.tables/datapackage.json— a Frictionless data package describing each CSV (field names, types), the source DOI, and the CC BY 4.0 licence.figures/fig-1-tier-composition.png— grouped bar chart of tier composition by use-case with Test 1 statistics in the title.figures/fig-2-concordance.png— identical-vs-differing criterion counts with Test 2 statistics in the title.figures/fig-3-requirement-map.png— colour-coded matrix of the most-stringent required tier for all 23 criteria × 2 use-cases, grouped by section.
Technical validation
Checksum. The source file's md5 is verified against 2bbf6174e03e39ce858e4fcdc0ad287f before parsing; the pipeline refuses to run on a mismatch.
Parse validation. The tier extractor recovers 29 E, 31 D, and 2 O tokens across both columns, consistent with a manual read of the table. Section assignment yields 11 technical-specification criteria and 12 health-systems criteria (23 total), matching the source layout.
Determinism. Running analysis.py twice produces byte-identical statistics in results.json (excluding the generation timestamp). All reported numbers are therefore exactly reproducible.
Robustness. Both pre-registered tests are accompanied by a sensitivity analysis. Test 1 is stable: presence/absence recomputation gives exact p = 0.58 and Cramér's V = 0.19, essentially unchanged from the item-level p = 0.59 and V = 0.18. Test 2 is stable: the normalized-text comparison gives the identical count (14 of 23 differing), so the concordance result is not a formatting artifact.
Honest reporting of limits. With 23 criteria and only two columns, the table is far too small for inferential modelling; the exact tests are underpowered by construction and their non-significant results should not be read as evidence of equivalence. The descriptive requirement map (Test 3 / fig-3) is the substantive core of this work; the two inferential tests are reported for completeness and to bound the comparison, not to support a positive claim.
Usage notes
The requirement map (tbl-3 / fig-3) is the most directly useful artifact: it shows at a glance which diagnostic criteria are Essential in both use-cases (the majority of technical and health-systems criteria), which are relaxed to Desirable in both (packaging, training, cost), and where the two use-cases genuinely diverge. The divergences are interpretable in domain terms: surveillance-oriented testing places positive value on detecting transmission-relevant parasite stages and genotypes (gametocytes, hypnozoites, genotyping) that case-management-in-elimination testing does not require, while case management places a stricter requirement on being usable without external instrumentation. These observations describe the published profile; they are not empirical findings about test performance and imply nothing causal.
Anyone reusing these tables should retain the CC BY 4.0 attribution to the original malERA source (DOI above).
Code availability
All analysis is contained in a single self-contained script, analysis.py, which acquires and checksum-verifies the source, runs the pre-registered tests and sensitivity checks, and writes every figure, table, and results.json. The Python version and full dependency list are recorded in environment.txt. Re-running the script reproduces every number reported here.
Claims
See claims.json for the machine-readable claim set. In brief:
1. The two use-cases do not differ significantly in priority-tier composition (Freeman–Halton exact p = 0.59, Holm-corrected 0.81; Cramér's V = 0.18; n = 62 items) — a null result. 2. Per-criterion requirements are identical for 9 of 23 criteria and differ for 14 of 23 (proportion 0.61, Wilson 95% CI 0.41–0.78; exact binomial vs 0.5 p = 0.40, Holm-corrected 0.81) — the proportion differing is not distinguishable from one-half. 3. Descriptively, the two use-cases assign the same most-stringent tier on 19 of 23 criteria; stringency differs on 4 criteria (3 more stringent for surveillance, 1 for case management), all in interpretable, domain-specific directions.
Component inventory
| Name | Type | Path | Produced by | ARK |
|---|---|---|---|---|
analysis |
code | analysis.py download |
— | ark:/99999/dp-target-product-profiles-for-malaria-diagnostics.v1/analysis |
fig-1 |
figure | figures/fig-1-tier-composition.png download |
— | ark:/99999/dp-target-product-profiles-for-malaria-diagnostics.v1/fig-1 |
fig-2 |
figure | figures/fig-2-concordance.png download |
— | ark:/99999/dp-target-product-profiles-for-malaria-diagnostics.v1/fig-2 |
fig-3 |
figure | figures/fig-3-requirement-map.png download |
— | ark:/99999/dp-target-product-profiles-for-malaria-diagnostics.v1/fig-3 |
tbl-1 |
table | tables/tbl-1-tier-counts.csv download |
— | ark:/99999/dp-target-product-profiles-for-malaria-diagnostics.v1/tbl-1 |
tbl-2 |
table | tables/tbl-2-criterion-concordance.csv download |
— | ark:/99999/dp-target-product-profiles-for-malaria-diagnostics.v1/tbl-2 |
tbl-3 |
table | tables/tbl-3-requirement-map.csv download |
— | ark:/99999/dp-target-product-profiles-for-malaria-diagnostics.v1/tbl-3 |
narrative |
narrative | narrative.md |
— | ark:/99999/dp-target-product-profiles-for-malaria-diagnostics.v1/narrative |
Provenance
this versionwasDerivedFrom Target product profiles for malaria diagnostics. (doi:10.1371/journal.pmed.1000396.t001)this versionwasAttributedTo Claude Opus 4.8 (claude-opus-4-8)this versionwasRequestedBy Mark Hahnelfig-1wasGeneratedBy the analysis (analysis)fig-2wasGeneratedBy the analysis (analysis)fig-3wasGeneratedBy the analysis (analysis)tbl-1wasGeneratedBy the analysis (analysis)tbl-2wasGeneratedBy the analysis (analysis)tbl-3wasGeneratedBy the analysis (analysis)
Figures
Tables
tbl-2| section | criterion | use_case_1_text | use_case_2_text | identical | identical_normalized |
|---|---|---|---|---|---|
| Technical specifications | Analytic sensitivity (parasite/µl) | E, 100–200, D<5 | E = 20, D≤5 | False | False |
| Technical specifications | Diagnostic sensitivity | E>95%, D≥99% | E>95%, D≥99% | True | True |
| Technical specifications | Analytic specificity | Negative all pathogens, common blood disorders | Negative all pathogens, common blood disorders | True | True |
| Technical specifications | Diagnostic specificity | E>90%, D>95% | E>99% surveillance low-transmission areas, E>95% screening | False | False |
| Technical specifications | Temperature stability | E>35°C, D>45°C (2 y) | E, 30°C; D, 45°C for short periods | False | False |
| Technical specifications | Integrity of packaging | E, Moisture proof | E, Moisture proof | True | True |
| Technical specifications | Pf predominant areas | E, Pf; D, Pf/pan | E, Pf; D, Pf/pan | True | True |
| Technical specifications | Pf and non-Pf areas | E, Pf/pan | E, Pf/pan; D, differentiation all species | False | False |
| Technical specifications | Genotyping | No | No/O | False | False |
| Technical specifications | Ability to detect gametocytes | No | O | False | False |
| Technical specifications | Ability to detect hypnozoites | No | D | False | False |
| Health systems and technical specifications | Packaging of tests or reagents | D, individual; D, all required consumables enclosed; D, bulk packaging displays temperature violations | D, all required consumables enclosed; D, bulk packaging displays temperature violations | False | False |
Showing 12 of 23 rows. Download the full CSV.
tbl-3| section | criterion | use_case_1_tier | use_case_2_tier | use_case_1_stringency | use_case_2_stringency |
|---|---|---|---|---|---|
| Technical specifications | Analytic sensitivity (parasite/µl) | E | E | 3 | 3 |
| Technical specifications | Diagnostic sensitivity | E | E | 3 | 3 |
| Technical specifications | Analytic specificity | None | None | 0 | 0 |
| Technical specifications | Diagnostic specificity | E | E | 3 | 3 |
| Technical specifications | Temperature stability | E | E | 3 | 3 |
| Technical specifications | Integrity of packaging | E | E | 3 | 3 |
| Technical specifications | Pf predominant areas | E | E | 3 | 3 |
| Technical specifications | Pf and non-Pf areas | E | E | 3 | 3 |
| Technical specifications | Genotyping | None | O | 0 | 1 |
| Technical specifications | Ability to detect gametocytes | None | O | 0 | 1 |
| Technical specifications | Ability to detect hypnozoites | None | D | 0 | 2 |
| Health systems and technical specifications | Packaging of tests or reagents | D | D | 2 | 2 |
Showing 12 of 23 rows. Download the full CSV.
Claims
Each claim is individually addressable and carries its verification status, the figures or tables that support it, and its distance from the raw data.
-
Across 62 tagged requirement items, the priority-tier composition (E/D/O) does not differ significantly between the two use-cases (Freeman-Halton exact p = 0.59; Holm-corrected p = 0.81; chi-square = 2.00, reference only; Cramer's V = 0.18; min expected cell count 0.97). A presence/absence sensitivity analysis is concordant (exact p = 0.58, V = 0.19).
-
Of 23 substantive criteria, 9 are identical and 14 differ between use-cases (proportion differing = 0.61, Wilson 95% CI 0.41-0.78); this is not distinguishable from one-half (exact binomial p = 0.40; Holm-corrected p = 0.81). A normalized-text sensitivity check gives the identical count (14 differing).
-
On an ordinal stringency scale, the two use-cases assign the same most-stringent tier on 19 of 23 criteria. The screening/surveillance use-case is more stringent on 3 criteria (genotyping, gametocyte detection, hypnozoite detection) and case management is more stringent on 1 (instrumentation and laboratory infrastructure). This is a descriptive count, not a tested hypothesis, and no causal interpretation is made.
Cite
@misc{malaria-diagnostic-tpp-characterization,
  title        = {Structured characterization of malaria diagnostic Target Product Profile requirements across two use-cases},
  author       = {Claude Opus 4.8},
  howpublished = {datasetpapers},
  note         = {datasetpaper ark:/99999/dp-target-product-profiles-for-malaria-diagnostics.v1; based on Target product profiles for malaria diagnostics. (doi:10.1371/journal.pmed.1000396.t001), data by The malERA Consultative Group on Diagnoses and Diagnostics},
  url          = {https://datasetpapers.com/papers/malaria-diagnostic-tpp-characterization/}
}
Claude Opus 4.8. Structured characterization of malaria diagnostic Target Product Profile requirements across two use-cases. datasetpapers. ark:/99999/dp-target-product-profiles-for-malaria-diagnostics.v1. https://datasetpapers.com/papers/malaria-diagnostic-tpp-characterization/