Hook
A storm's magnetic heart, weighed near the Sun and far past Jupiter
Line up all 1,972 catalogued interplanetary coronal mass ejections by which spacecraft observed them, and a pattern jumps out before any statistics are needed. MESSENGER, which crossed these structures at a typical distance of 0.41 AU from the Sun, measured a typical magnetic-obstacle field of 43.5 nanotesla. Ulysses, sampling from a typical distance of 4.80 AU — more than eleven times farther out — measured a typical field of just 1.3 nanotesla. Same kind of structure, same measurement, a 33.5-fold difference.
Median magnetic-obstacle field vs. median heliocentric distance, one bubble per spacecraft (bubble size = event count). MESSENGER and Ulysses are highlighted.
What both spacecraft are actually measuring is the "magnetic obstacle": the smooth, coherent, twisted rope of magnetic field embedded inside a coronal mass ejection once it leaves the Sun and becomes an interplanetary one. Billions of tonnes of solar plasma get launched at speeds topping 1,000 kilometres per second, dragging a magnetic field with them — and as that rope of field expands into the emptiness of interplanetary space, physics says it should weaken.
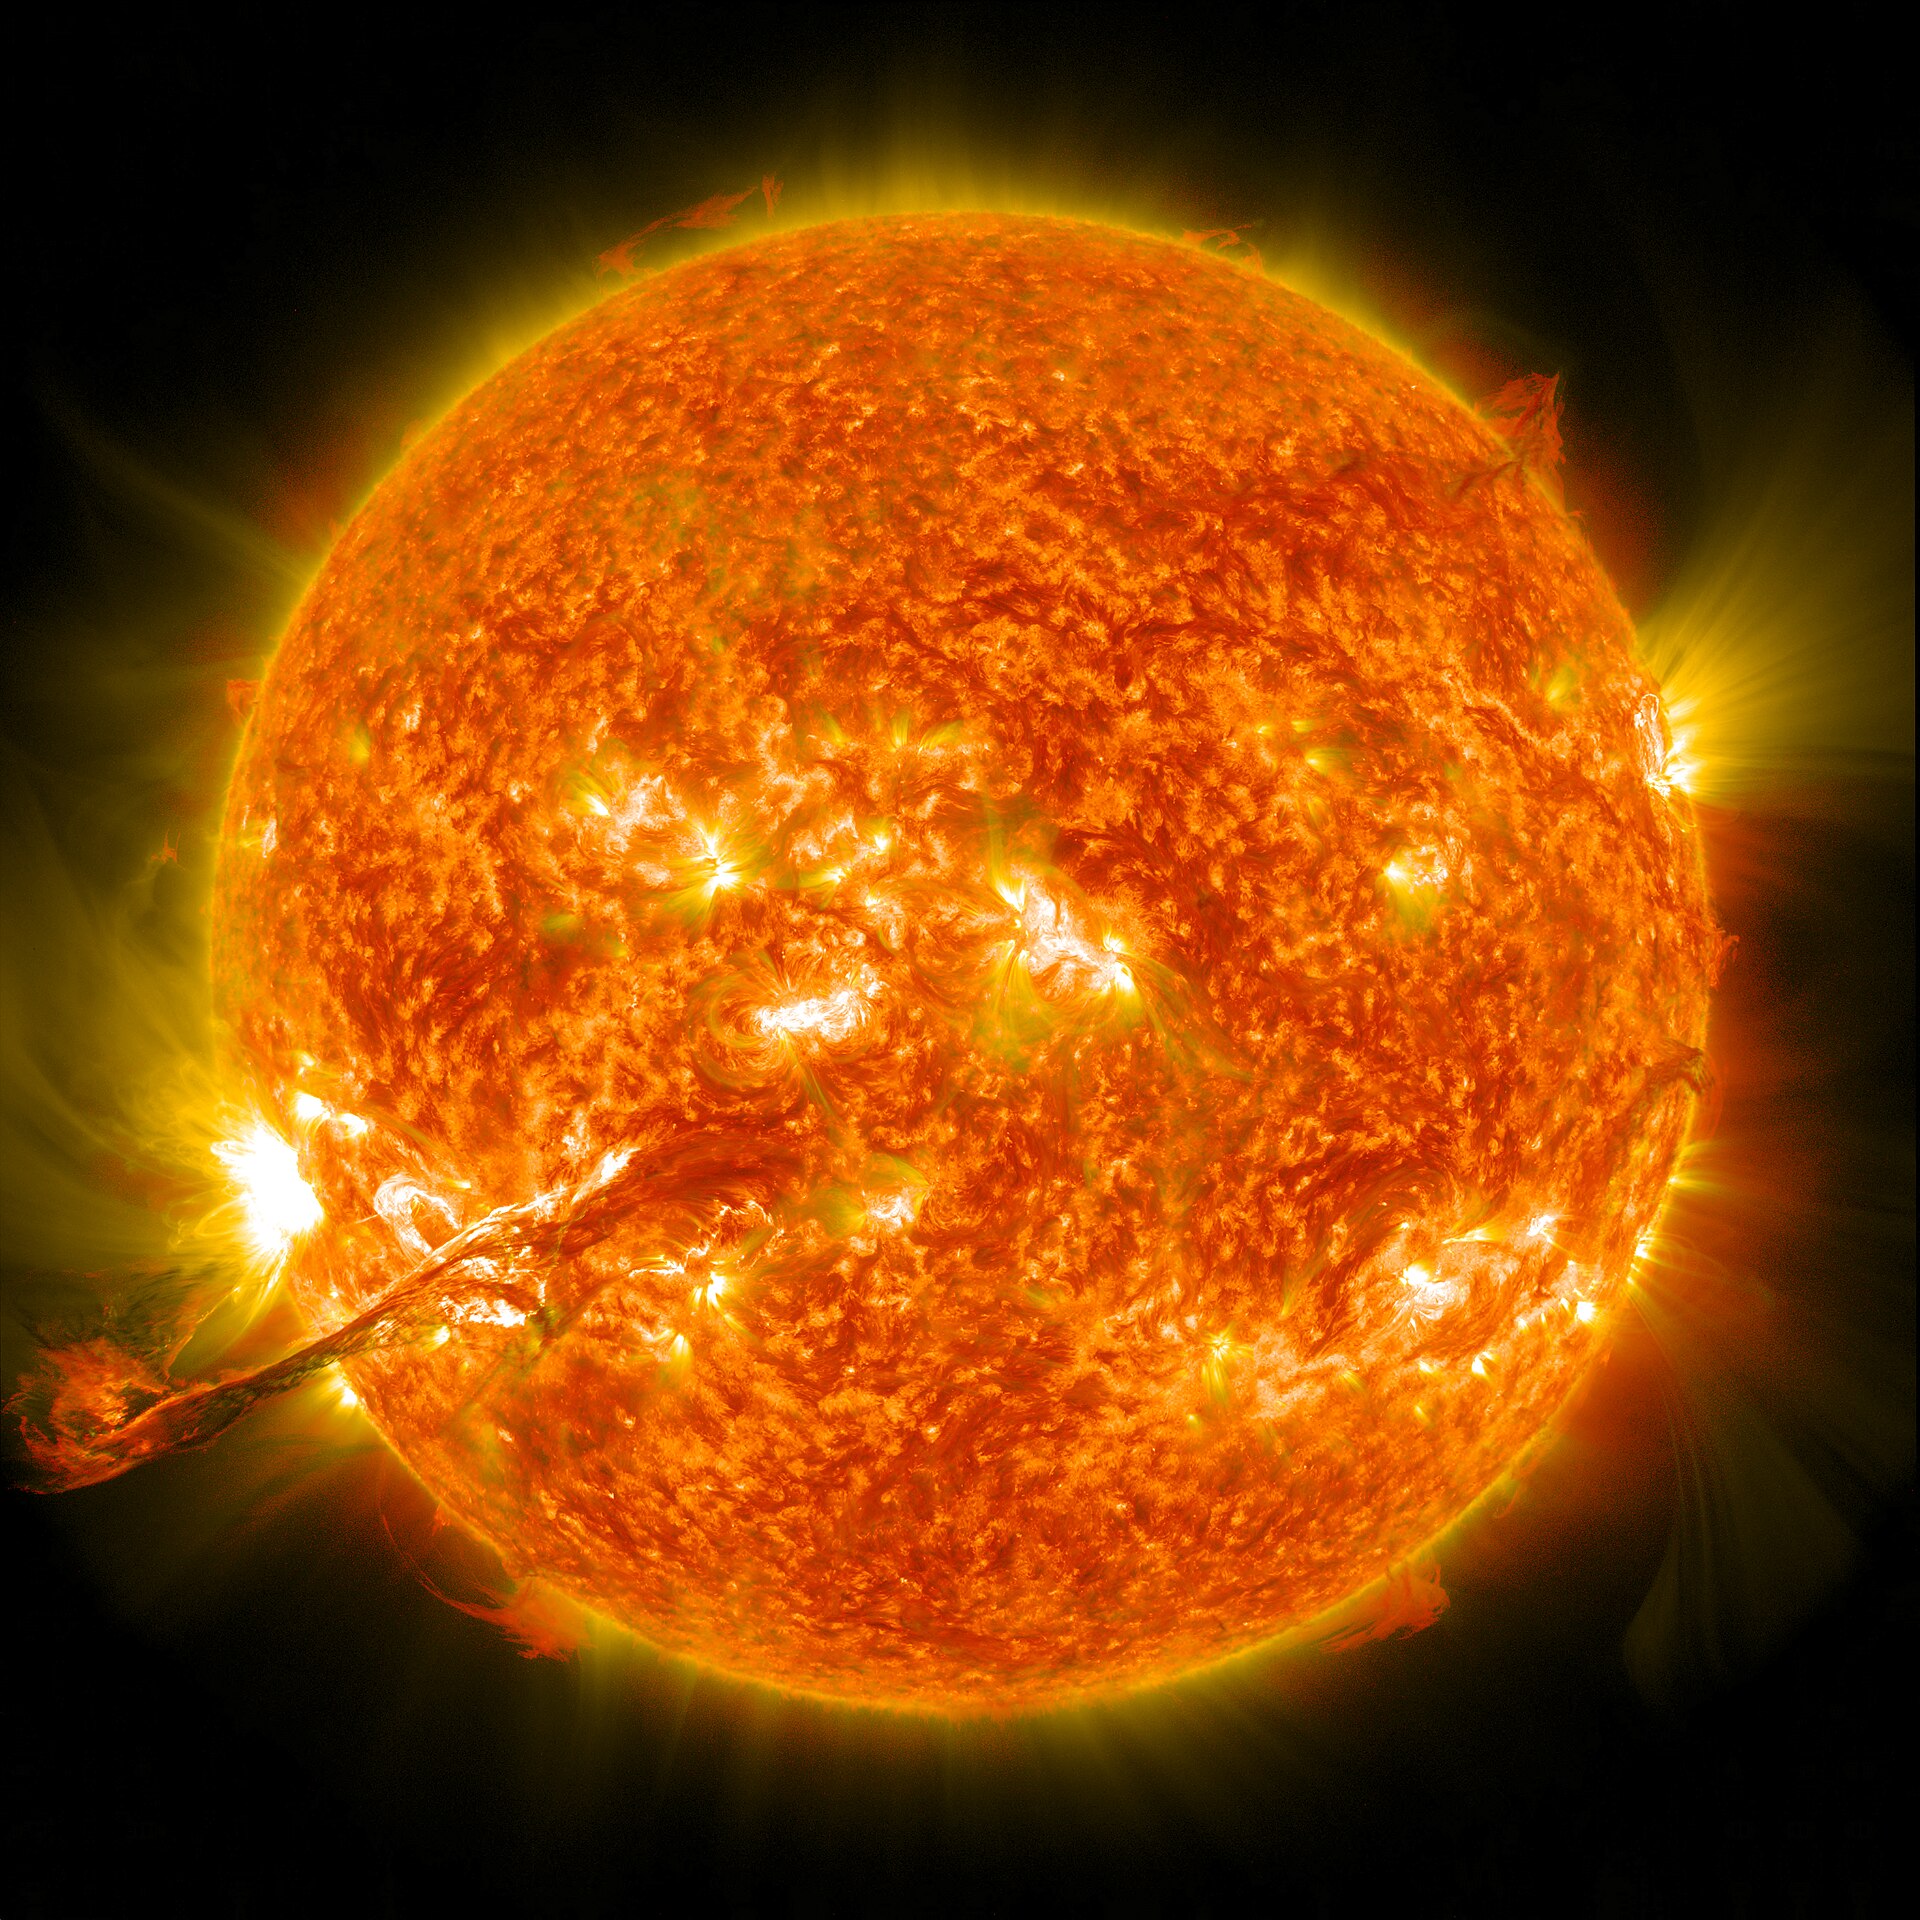
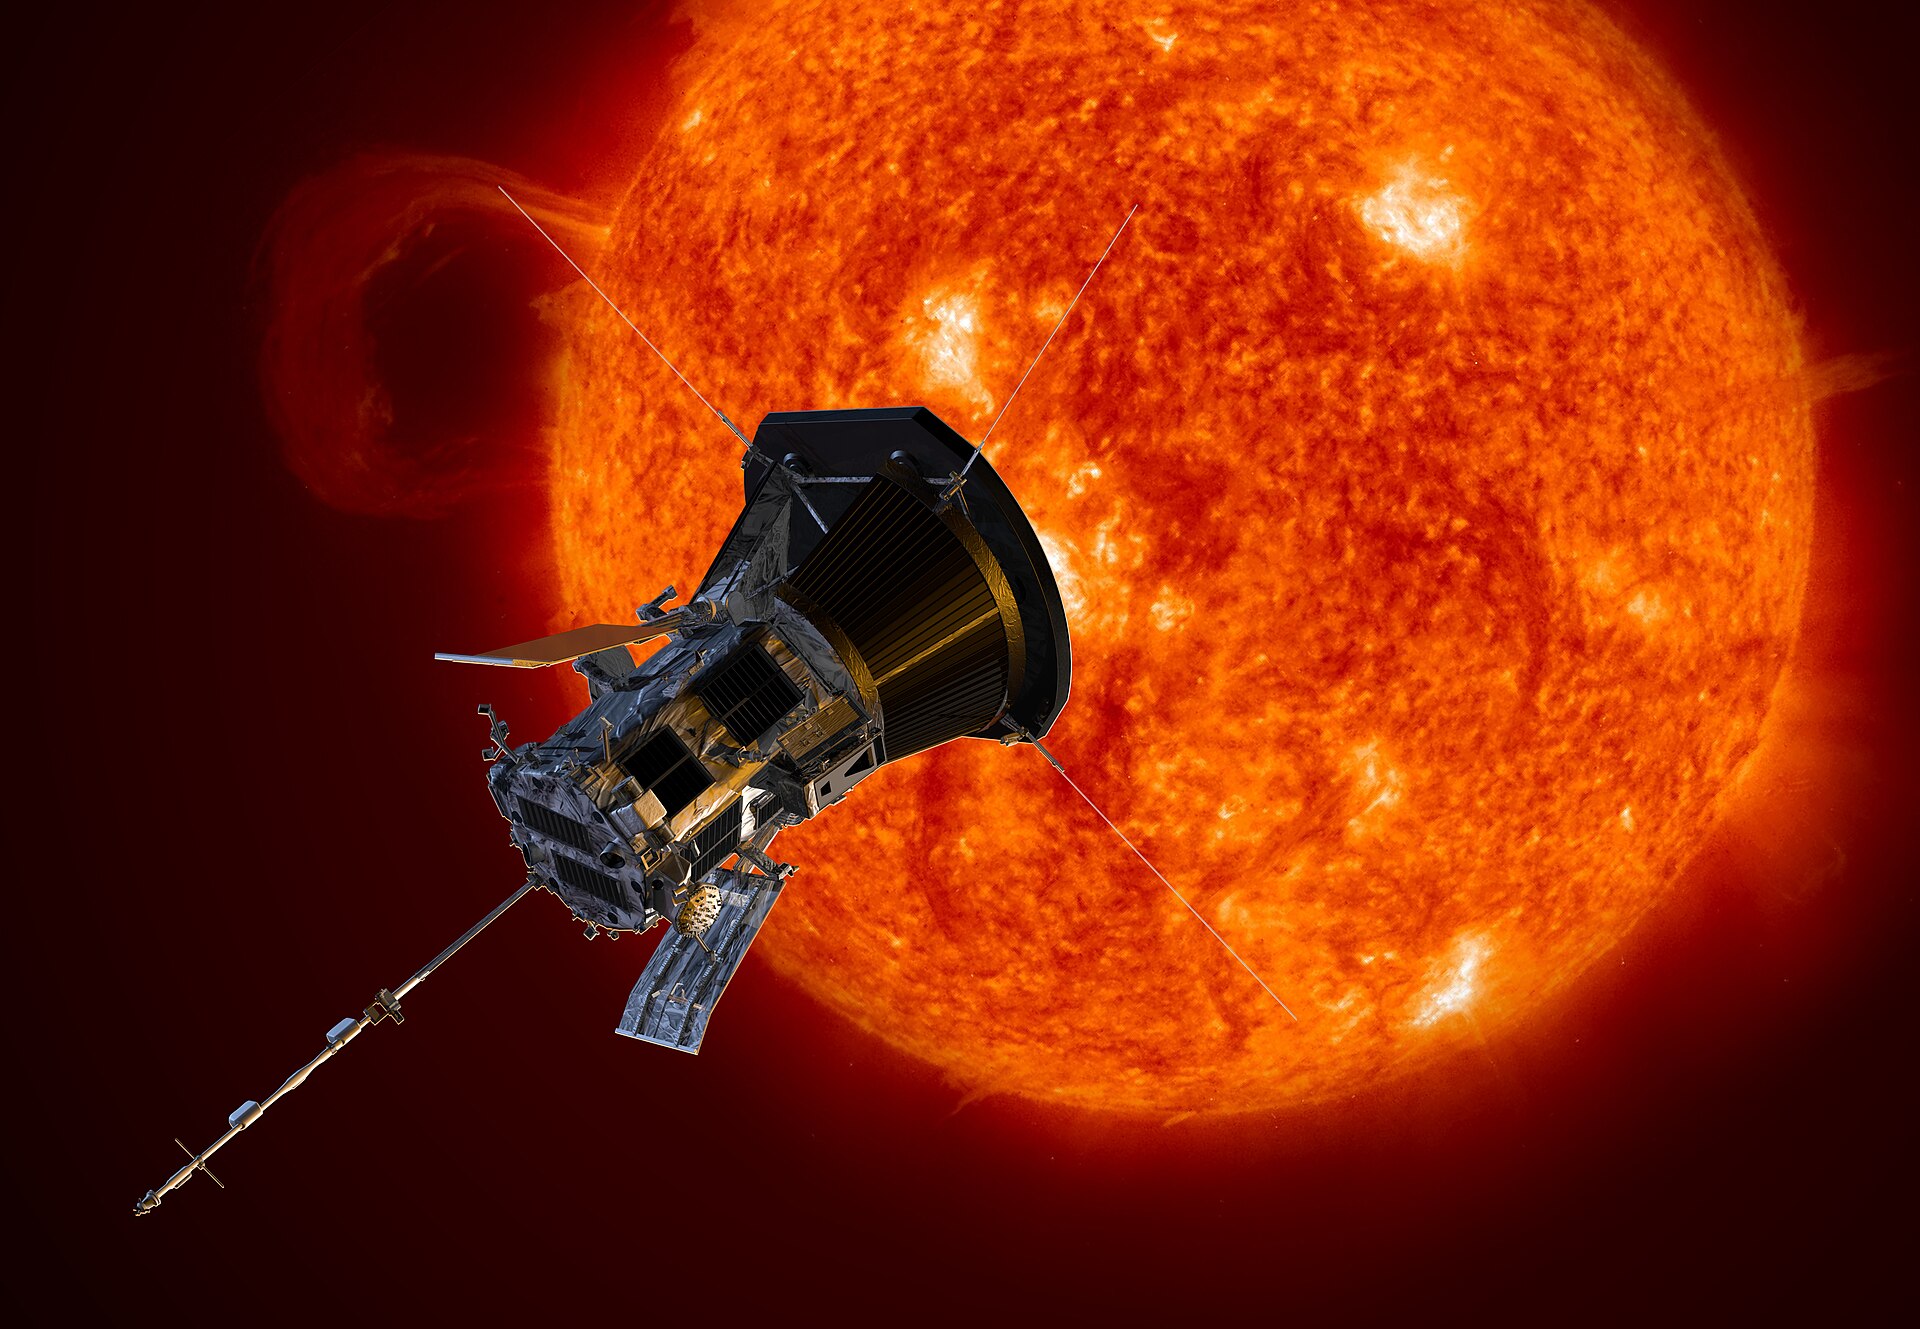
What makes this particular measurement possible is an unusually crowded and unusually wide observing fleet: eleven spacecraft, from Parker Solar Probe dipping to 0.0685 AU — inside Mercury's orbit — out to Juno past 5.4 AU, beyond Jupiter's. Historically, this kind of question relied on a handful of Helios flybys or occasional multi-spacecraft conjunctions. Here, six different instruments each have wide enough individual radial coverage to test the trend entirely on their own.
The question this analysis was built to answer, precisely: how fast does that field really fall off with distance — and can eleven differently calibrated instruments, flown decades apart, actually agree on the answer?
Context
Why the strength of a solar storm's magnetic field is worth measuring at all
A coronal mass ejection's punch to Earth's magnetic field depends heavily on how strong its magnetic field is and which way it points when it arrives — a strong, southward-tilted field reconnects efficiently with Earth's own field and drives a bigger geomagnetic storm. Forecasters increasingly want an early warning: a field-strength reading taken well before the storm reaches Earth, from a spacecraft near the Sun, near Mercury, or off to one side. Turning that early reading into a prediction for what Earth will feel requires exactly the kind of radial scaling law this catalogue quantifies.
Explore: the fleet, by distance and field strength
The catalogue behind this analysis — HELIO4CAST's ICMECAT v2.3, built by Christian Möstl, Eva Weiler and Emma Davies at the Austrian Space Weather Office — is not an automated detection list. Every one of its 1,976 events (1,972 retained here after dropping four with missing or non-positive values) was hand-identified: a human decided exactly where each flux-rope-like interval begins and ends in the raw magnetometer data.
With the "why" and the "what" established, the analysis itself asks a single, pre-registered question: fit a power law, B ~ r-alpha, to field strength against distance, and see if it holds.
Evidence
The measurement: field strength falls as a power law
The primary, pre-registered test is blunt: rank every one of the 1,972 events by distance, rank them by field strength, and see how well the two rankings line up. They line up strongly — Spearman's rho = -0.754, a p-value so small it registers as indistinguishable from zero, and a correlation strong enough that heliocentric distance alone explains more than half of the rank-order variance (rho² = 0.568) in a dataset spanning eleven instruments and three solar cycles.
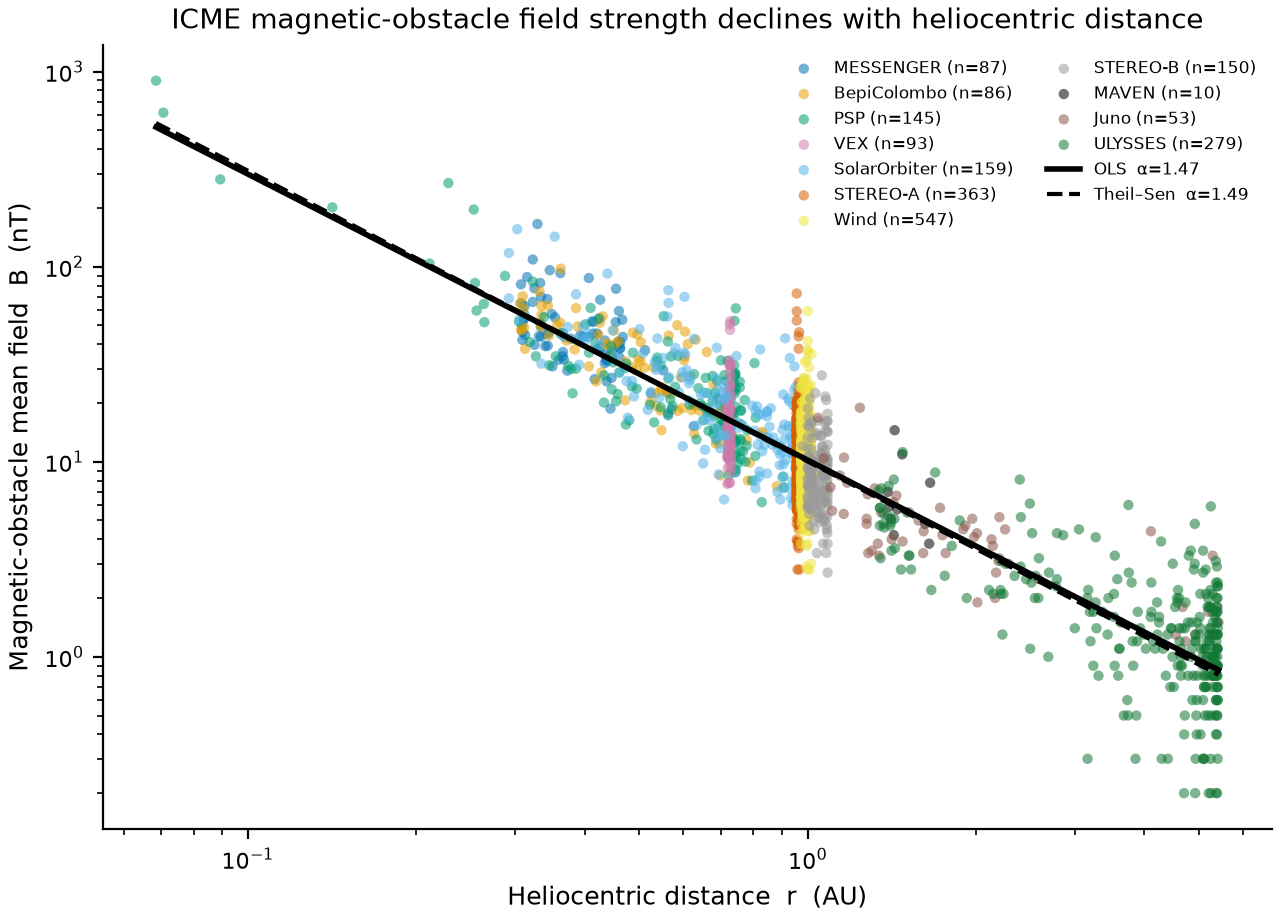
Fitting an actual power law to the same data gives an exponent of alpha = 1.465 (95% bootstrap confidence interval [1.428, 1.504], R² = 0.820). Run that fitted curve out across the sampled distance range and the scale of the effect becomes concrete: the model predicts roughly 298 nanotesla at 0.1 AU, near where Parker Solar Probe flies, against roughly 1 nanotesla at 5 AU, out near Jupiter — a roughly 309-fold decline in typical field strength.
Power-law exponent alpha from two independent estimators, with 95% confidence intervals. The shaded band shows where they overlap.
Because a single-method fit can be fooled by a handful of extreme events, the analysis re-ran the same fit with the Theil-Sen estimator, which is built to resist exactly that kind of distortion. It returns alpha = 1.490 (95% CI [1.453, 1.527]) — a difference of just 0.025, or 1.7%, from the original fit, with overlapping confidence intervals. Two very differently behaved estimators, same answer.
A clean fit across 1,972 events pooled from eleven spacecraft is exactly the kind of result that invites a follow-up question: is this one real radial effect, or eleven different instruments each contributing their own bias that happens to average out to something that looks like a trend?
Evidence
Proving it isn't just one clumsy spacecraft
Split the ten spacecraft with at least 30 events into two groups — those whose orbits gave them a radial baseline of 0.30 AU or more, and those that observed from an essentially fixed distance — and the data runs its own built-in experiment. All six wide-baseline spacecraft (Juno, Ulysses, Parker Solar Probe, Solar Orbiter, BepiColombo, MESSENGER) show a statistically significant negative correlation, every one with a corrected p-value below one in ten billion, and their individual exponents cluster between 0.97 and 1.64 — right around the global estimate. None of the four narrow-baseline spacecraft (STEREO-B, Wind, STEREO-A, Venus Express, each spanning under 0.11 AU) reach significance, and their fitted exponents swing wildly — from -9.72 to +4.39, including physically meaningless positive values.
Per-spacecraft power-law exponent, sorted by radial baseline width. Wide-baseline spacecraft (solid) cluster near the global alpha; narrow-baseline spacecraft (hollow) scatter without a stable sign.
More tellingly, three of those wide-baseline spacecraft can each answer the question entirely on their own, with no comparison to any other instrument required. Parker Solar Probe alone: rho = -0.698 (n=145). Juno alone: rho = -0.778 (n=53). Ulysses alone: rho = -0.525 (n=279). All three corrected p-values are below one in ten billion. Because each of these is a single-instrument result, none of them can be blamed on cross-calibration differences between spacecraft — this is the strongest evidence available that the decline is a real property of the magnetic obstacle itself.
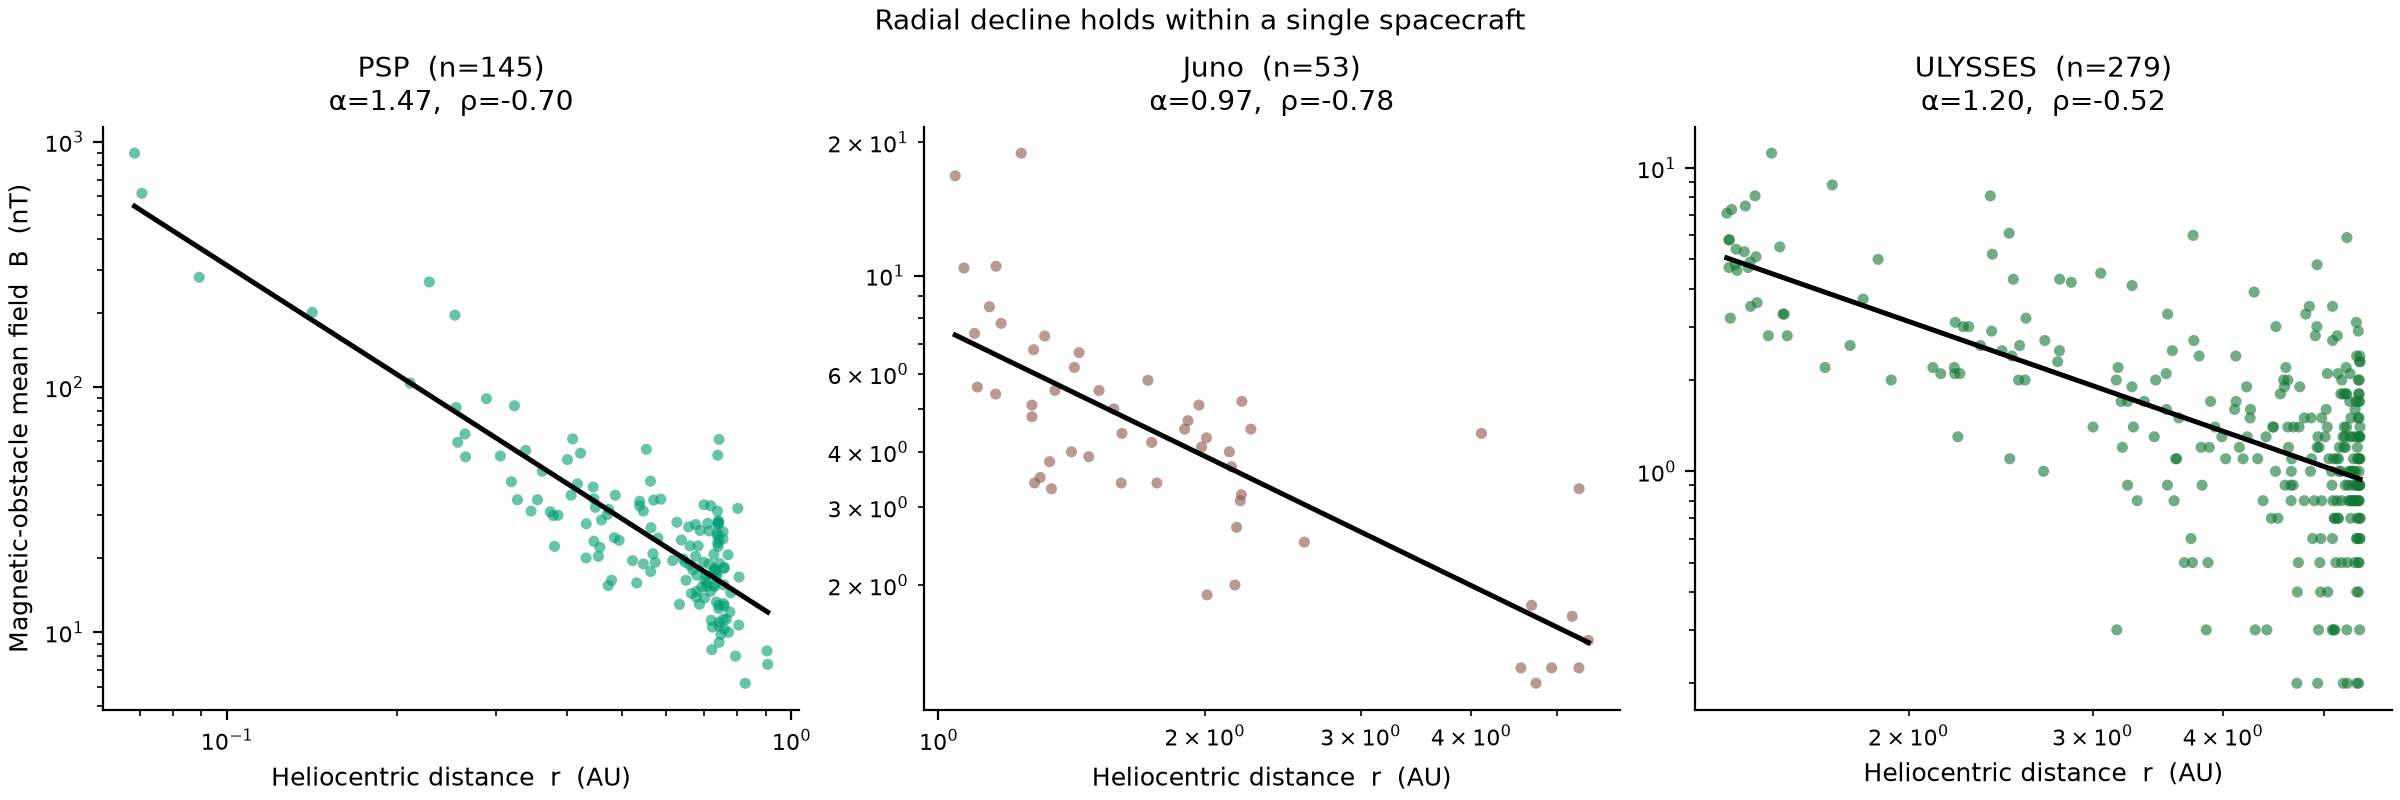
Running Benjamini-Hochberg correction across all thirteen guard tests together — the ten per-spacecraft tests plus the three within-instrument tests — changes nothing about which results are significant: nine of thirteen remain significant, and the four that don't are precisely the four narrow-baseline spacecraft, exactly where the geometry predicts the test should have no power.
None of this makes the underlying sample a controlled experiment. No spacecraft flew a deliberate radial survey; each observed from wherever its actual mission trajectory and solar-cycle timing put it. What these guards establish is narrower and more defensible: that the radial trend survives being tested within single instruments, one at a time, rather than resting on a global fit that mixes eleven different observing histories together.
Evidence
Removing spacecraft one at a time
As a final stress test, the global fit was re-run eleven separate times, each time with one spacecraft's events removed entirely. The resulting exponent barely moves: from 1.452 (with Solar Orbiter excluded) to 1.532 (with Ulysses excluded) — a range of just 0.080 around the full-sample value of 1.465. Ulysses turns out to be the single most influential spacecraft, which makes sense given it anchors the far end of the distance range with 279 events; removing it shifts the exponent by 0.067. Even that largest possible shift is smaller than the width of the fit's own bootstrap confidence interval.
Try it: remove a spacecraft, watch the exponent move
The exponent, in other words, does not belong to any one spacecraft. But an exponent that is this well-defended still has to answer to one more test: does it match what everyone else who has measured this has found?
Turn
A gentler decline than everyone before it found
This is not new territory. Farrugia and colleagues, using Helios data between 0.3 and 1 AU back in 2005, put the exponent at 1.73. Leitner and colleagues, fitting seven tightly matched multi-spacecraft events in 2007, got a much steeper 2.0, before a larger 130-event follow-up brought that down to 1.64 (with a wide ±0.40 uncertainty). Winslow and colleagues, using MESSENGER data in 2015, reported 1.89.
This study's two estimates against four external benchmarks, sorted low to high. Shaded band marks the published-literature range [1.57, 2.00].
Lined up against all four of those numbers, this study's estimate is the lowest in the set — both the OLS value (1.465) and the Theil-Sen value (1.490) fall below the entire published range of [1.57, 2.00]. The nearest external estimate is 0.105 away. The direction and rough scale of the effect are not in doubt; the exact steepness is where this analysis and the prior literature start to diverge.
A near-contemporaneous reanalysis of an updated version of this same catalogue lineage (1,976 events, the same eleven missions) reports a steeper 1.57 for the mean field using a single power law — and its authors go further, arguing a single power law isn't quite the right model at all, proposing instead a break in the slope close to the Sun. That two analyses of essentially the same underlying catalogue can land 0.10 apart depending on modelling choices — mean field versus peak field, single power law versus a break near the Sun, exact event selection — is itself the finding worth sitting with.
None of this undermines the headline result. It reframes it: "the field falls off as roughly r-1.5" is a much safer thing to say than "the exponent is precisely 1.465" — and the gap between this estimate and the rest of the literature is a reminder that even a heavily guarded statistic still carries the fingerprints of the choices that produced it.
Close
What this catalogue does — and doesn't — tell us
One thing is not in question: the arithmetic. An independent, isolated re-execution of the analysis code, run from the same pinned, checksum-verified source file on a completely separate software stack, reproduced all 223 numeric values in the published results with zero mismatches and a maximum difference of exactly 0.0. Whatever one makes of the exponent itself, the code that produced it does precisely what it claims to do.
What it can't do is settle the underlying physics. Six spacecraft each independently confirm the direction of the effect, and the leave-one-out test says no single instrument drives it — but the sample still isn't a controlled radial survey. Each spacecraft flew whatever orbit its actual mission needed, during whatever phase of an unpredictable, 11-year solar cycle it happened to be flying, and those differences in instrumentation and epoch are folded into the global number rather than separated out. The scatter around the fitted line, even where it's strongest, is substantial: an R² of 0.82 means a fifth of the variance is left unexplained by distance alone.
Hear it: field strength by spacecraft, near to far
11 tones, one per spacecraft, ordered by distance from the Sun — pitch falls as the typical field strength falls. If sound is unavailable, the chart in the hook section above already shows the same pattern.
So the next interplanetary coronal mass ejection someone measures near the Sun will, in expectation, arrive at Earth with a weaker field, on roughly the schedule this catalogue describes — but "roughly" is doing real work in that sentence, and the next spacecraft to extend this radial baseline further will get to test, once again, whether 1.465 holds up.
References
- DataHELIO4CAST Interplanetary Coronal Mass Ejection Catalog v2.3 (ICMECAT) — Christian Möstl, Eva Weiler, Emma Davies, Austrian Space Weather Office / GeoSphere Austria. figshare, DOI 10.6084/m9.figshare.6356420.v24. MIT licence.
- DataICMECAT — a catalog of interplanetary coronal mass ejections — helioforecast.space, maintained by the Austrian Space Weather Office.
- StudyGeo-effectiveness and radial dependence of magnetic cloud parameters — source of the Farrugia et al. (2005), Leitner et al. (2007) and Winslow et al. (2015) radial-scaling exponents cited above.
- StudyOn the magnetic field evolution of interplanetary coronal mass ejections from 0.07 to 5.4 au — the near-contemporaneous reanalysis referenced in "A gentler decline than everyone before it found."
- ContextCoronal Mass Ejections — NOAA / NWS Space Weather Prediction Center.
- ToolsCharts rendered with Vega-Lite 5 / Vega-Embed 6. Figures fig-1 and fig-3 are reproduced verbatim from the research object's own analysis.py output (matplotlib), not redrawn.