
Datasetpaper · process mining / operations analytics
Help-desk case resolution time by service level
Data story Read the interactive, evidence-linked version of this paper →Paper is a compiled reading view, rendered from the underlying research object (an RO-Crate) — not hand-edited. Object shows that same object taken apart: its individually addressable components, their provenance, and the machine-readable exports agents can fetch directly. Switch above.
- Version
ark:/99999/dp-dataset-belonging-to-the-help-desk-log-of-an-italian-company.v1- Concept
ark:/99999/dp-dataset-belonging-to-the-help-desk-log-of-an-italian-company
Summary
Using the event log of an Italian company's help desk (21,348 events across 4,580 support cases, 2010–2014), we asked whether the time taken to resolve a ticket differs across the service-level tiers recorded for each case. Because the log records multiple events per case, we aggregated it to one row per case and used the case as the unit of analysis, guarding against pseudoreplication. The primary outcome was the time from a case's first event to its first "Resolve ticket" activity.
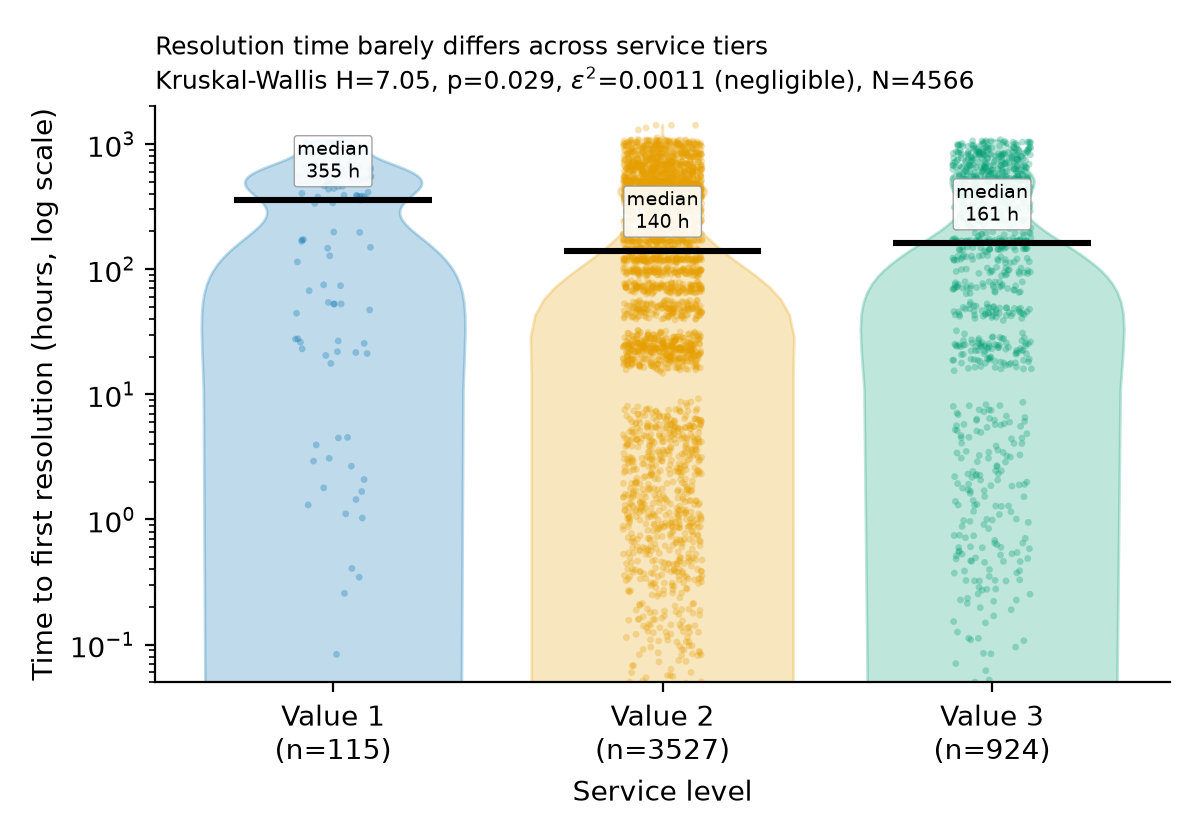
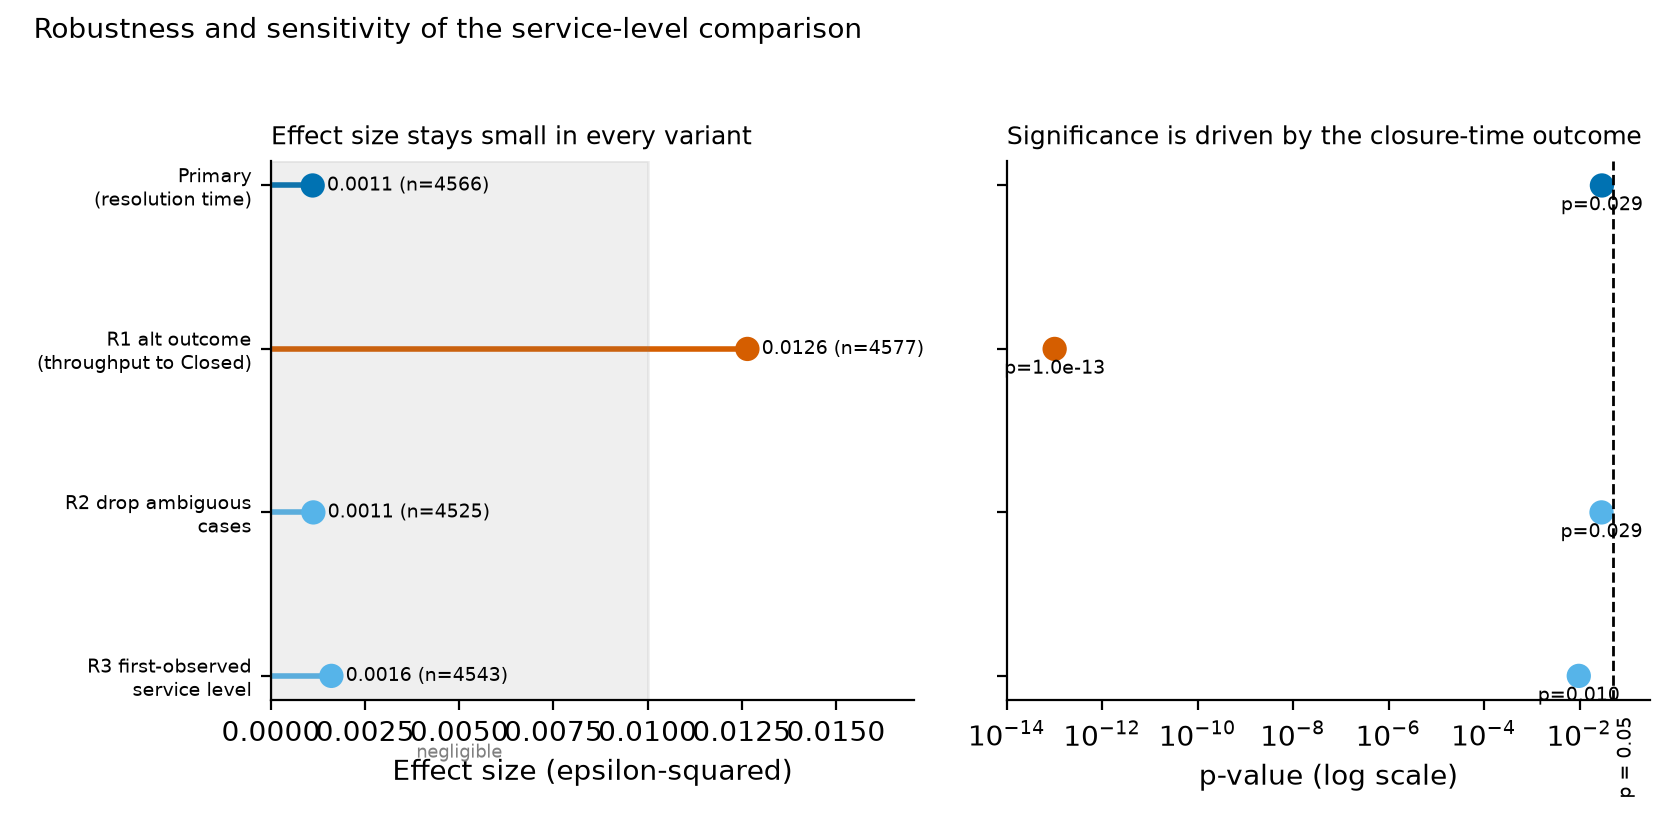
A Kruskal-Wallis test across the three well-populated tiers (Value 1, n=115; Value 2, n=3527; Value 3, n=924) was statistically significant but with a negligible effect size (H=7.05, df=2, p=0.029, epsilon-squared=0.0011). No pairwise difference survived Holm correction (all corrected p ≥ 0.14). The practical conclusion is that case handling time is essentially the same across service tiers. A robustness check using the full time-to-closure outcome instead produced a much smaller p-value (p≈1.0×10⁻¹³) but a still-small effect (epsilon-squared=0.0126), indicating that the modest tier differences that do exist are concentrated in administrative closure timing rather than in how quickly tickets are actually resolved. The finding was stable when ambiguous cases were dropped and when the service level was defined by its first observed value.
Provenance and methods
Source data. The analysis uses finale.csv from the dataset "Dataset belonging to the help desk log of an Italian Company" (DOI 10.4121/uuid:0c60edf1-6f83-4e75-9367-4c63b3e9d5bb), distributed under the 4TU.ResearchData General Terms of Use. The file (3,271,588 bytes, md5 a91d74377c55be5cbdfda05dae69db30) is a process-mining event log with one row per recorded activity. The analysis script downloads the canonical copy and verifies its md5; if the download is unavailable it falls back to a local copy that is also md5-gated, so a checksum mismatch is a hard failure.
Aggregation to case level. Each of the 4,580 cases (Case ID) comprises 2–15 timestamped events (median 4). For every case we computed: the number of events; the throughput time (first to last event); the resolution time (first event to first "Resolve ticket" event); and the case's service level as the modal service_level value across its events. Timestamps were parsed with the format %Y/%m/%d %H:%M:%S.%f.
Grouping variable. service_level takes four values. Value 4 occurs in only 3 cases and was excluded a priori; the analysis compares Value 1, Value 2, and Value 3. The attribute is near-constant within a case: only 43 of 4,580 cases (0.9%) show more than one distinct service level.
Statistical tests. Resolution time is strongly right-skewed, so we used nonparametric methods throughout. The primary test was a Kruskal-Wallis H test across the three tiers, with epsilon-squared as the effect size. Follow-up pairwise comparisons used Mann-Whitney U tests (three pairs) with Holm correction for multiple comparisons and rank-biserial correlation as the pairwise effect size. All random operations (jitter in the figure) use a fixed seed (20240517).
Pre-registration. The question, outcome definition, grouping, exclusion of Value 4, primary test, correction method, and the three robustness/sensitivity checks below were fixed before the confirmatory tests were run.
Data records
The analysis derives the following records, all reproduced by analysis.py:
- Case-level table (in-memory): one row per
Case IDwithn_events,throughput_h,resolve_h, modalservice_level, first-observedservice_level, and an ambiguity flag. tables/tbl-1-resolution-summary-by-tier.csv— per-tier count, median, mean, quartiles, minimum and maximum of resolution time (hours).tables/tbl-2-robustness-sensitivity.csv— Kruskal-Wallis statistic, df, p, epsilon-squared and n for the primary test and the three robustness/sensitivity variants.tables/datapackage.json— a Frictionless tabular-data-package describing both CSVs (field names, types, descriptions).results.json— every statistic reported here, including the pairwise Mann-Whitney results with Holm-corrected p-values and rank-biserial effect sizes, and the run metadata (seed, md5, counts, time span).figures/fig-1-resolution-by-service-level.png— distribution of resolution time by tier (violin + jittered points + median), log-scaled.figures/fig-2-robustness-sensitivity.png— effect size and p-value across the primary and robustness variants.
Technical validation
The event log has no missing values in any column. All 4,580 cases have valid timestamps; 4,569 have at least one "Resolve ticket" event (11 cases never reach resolution and are absent from the resolution-time analysis but present in the throughput check). The primary comparison therefore rests on 4,566 cases (the 4,569 with a resolution time minus 3 in the excluded Value 4 tier).
The conclusion is robust to two analytic choices. Dropping the 43 cases whose service level is not constant within the case leaves the result essentially unchanged (H=7.09, p=0.029, epsilon-squared=0.0011). Defining the service level by its first observed value rather than the mode gives a slightly larger but still negligible effect (H=9.28, p=0.010, epsilon-squared=0.0016). The alternative outcome — full time-to-closure — yields a far smaller p-value (H=59.86, p≈1.0×10⁻¹³) yet an effect size (epsilon-squared=0.0126) that remains small by conventional benchmarks, locating whatever tier signal exists in the closure phase rather than in resolution speed.
Re-running analysis.py reproduces every number in results.json and regenerates every figure and table.
Usage notes
The service-level, seriousness, and section fields are anonymised categorical codes ("Value 1", "Value 2", …); their real-world meaning is not recoverable from the log, so the tiers cannot be ordered by any external criterion and no causal interpretation is warranted. All times are in hours. Throughput-to-closure is dominated by a roughly fixed administrative delay between resolution and closure and should not be read as handling effort; the resolution-time outcome is the appropriate measure of how quickly tickets are worked. This is an observational event log: differences across tiers may reflect ticket mix, staffing, or routing rather than the service level itself.
Code availability
The complete analysis is contained in analysis.py, which is self-contained and reproducible: it acquires and md5-verifies the source file, sets all seeds, runs the pre-registered tests, and writes every figure, table, and results.json. The Python version and full dependency list are recorded in environment.txt.
Claims
1. Across the three well-populated service-level tiers, case resolution time differs to a statistically detectable but practically negligible degree (Kruskal-Wallis H=7.05, df=2, p=0.029, epsilon-squared=0.0011, N=4566), and no pairwise difference survives Holm correction (all corrected p ≥ 0.14). 2. The negligible resolution-time difference is stable under sensitivity analyses: dropping the 43 within-case ambiguous cases (H=7.09, p=0.029, epsilon-squared=0.0011) and using first-observed rather than modal service level (H=9.28, p=0.010, epsilon-squared=0.0016) both leave the effect negligible. 3. When the outcome is instead the full time to case closure, the tier difference is far more significant but still small in magnitude (H=59.86, df=2, p≈1.0×10⁻¹³, epsilon-squared=0.0126, N=4577), indicating the signal lies in administrative closure timing rather than in resolution speed.
Parts
Summary
Using the event log of an Italian company's help desk (21,348 events across 4,580 support cases, 2010–2014), we asked whether the time taken to resolve a ticket differs across the service-level tiers recorded for each case. Because the log records multiple events per case, we aggregated it to one row per case and used the case as the unit of analysis, guarding against pseudoreplication. The primary outcome was the time from a case's first event to its first "Resolve ticket" activity.
A Kruskal-Wallis test across the three well-populated tiers (Value 1, n=115; Value 2, n=3527; Value 3, n=924) was statistically significant but with a negligible effect size (H=7.05, df=2, p=0.029, epsilon-squared=0.0011). No pairwise difference survived Holm correction (all corrected p ≥ 0.14). The practical conclusion is that case handling time is essentially the same across service tiers. A robustness check using the full time-to-closure outcome instead produced a much smaller p-value (p≈1.0×10⁻¹³) but a still-small effect (epsilon-squared=0.0126), indicating that the modest tier differences that do exist are concentrated in administrative closure timing rather than in how quickly tickets are actually resolved. The finding was stable when ambiguous cases were dropped and when the service level was defined by its first observed value.
Provenance and methods
Source data. The analysis uses finale.csv from the dataset "Dataset belonging to the help desk log of an Italian Company" (DOI 10.4121/uuid:0c60edf1-6f83-4e75-9367-4c63b3e9d5bb), distributed under the 4TU.ResearchData General Terms of Use. The file (3,271,588 bytes, md5 a91d74377c55be5cbdfda05dae69db30) is a process-mining event log with one row per recorded activity. The analysis script downloads the canonical copy and verifies its md5; if the download is unavailable it falls back to a local copy that is also md5-gated, so a checksum mismatch is a hard failure.
Aggregation to case level. Each of the 4,580 cases (Case ID) comprises 2–15 timestamped events (median 4). For every case we computed: the number of events; the throughput time (first to last event); the resolution time (first event to first "Resolve ticket" event); and the case's service level as the modal service_level value across its events. Timestamps were parsed with the format %Y/%m/%d %H:%M:%S.%f.
Grouping variable. service_level takes four values. Value 4 occurs in only 3 cases and was excluded a priori; the analysis compares Value 1, Value 2, and Value 3. The attribute is near-constant within a case: only 43 of 4,580 cases (0.9%) show more than one distinct service level.
Statistical tests. Resolution time is strongly right-skewed, so we used nonparametric methods throughout. The primary test was a Kruskal-Wallis H test across the three tiers, with epsilon-squared as the effect size. Follow-up pairwise comparisons used Mann-Whitney U tests (three pairs) with Holm correction for multiple comparisons and rank-biserial correlation as the pairwise effect size. All random operations (jitter in the figure) use a fixed seed (20240517).
Pre-registration. The question, outcome definition, grouping, exclusion of Value 4, primary test, correction method, and the three robustness/sensitivity checks below were fixed before the confirmatory tests were run.
Data records
The analysis derives the following records, all reproduced by analysis.py:
- Case-level table (in-memory): one row per
Case IDwithn_events,throughput_h,resolve_h, modalservice_level, first-observedservice_level, and an ambiguity flag. tables/tbl-1-resolution-summary-by-tier.csv— per-tier count, median, mean, quartiles, minimum and maximum of resolution time (hours).tables/tbl-2-robustness-sensitivity.csv— Kruskal-Wallis statistic, df, p, epsilon-squared and n for the primary test and the three robustness/sensitivity variants.tables/datapackage.json— a Frictionless tabular-data-package describing both CSVs (field names, types, descriptions).results.json— every statistic reported here, including the pairwise Mann-Whitney results with Holm-corrected p-values and rank-biserial effect sizes, and the run metadata (seed, md5, counts, time span).figures/fig-1-resolution-by-service-level.png— distribution of resolution time by tier (violin + jittered points + median), log-scaled.figures/fig-2-robustness-sensitivity.png— effect size and p-value across the primary and robustness variants.
Technical validation
The event log has no missing values in any column. All 4,580 cases have valid timestamps; 4,569 have at least one "Resolve ticket" event (11 cases never reach resolution and are absent from the resolution-time analysis but present in the throughput check). The primary comparison therefore rests on 4,566 cases (the 4,569 with a resolution time minus 3 in the excluded Value 4 tier).
The conclusion is robust to two analytic choices. Dropping the 43 cases whose service level is not constant within the case leaves the result essentially unchanged (H=7.09, p=0.029, epsilon-squared=0.0011). Defining the service level by its first observed value rather than the mode gives a slightly larger but still negligible effect (H=9.28, p=0.010, epsilon-squared=0.0016). The alternative outcome — full time-to-closure — yields a far smaller p-value (H=59.86, p≈1.0×10⁻¹³) yet an effect size (epsilon-squared=0.0126) that remains small by conventional benchmarks, locating whatever tier signal exists in the closure phase rather than in resolution speed.
Re-running analysis.py reproduces every number in results.json and regenerates every figure and table.
Usage notes
The service-level, seriousness, and section fields are anonymised categorical codes ("Value 1", "Value 2", …); their real-world meaning is not recoverable from the log, so the tiers cannot be ordered by any external criterion and no causal interpretation is warranted. All times are in hours. Throughput-to-closure is dominated by a roughly fixed administrative delay between resolution and closure and should not be read as handling effort; the resolution-time outcome is the appropriate measure of how quickly tickets are worked. This is an observational event log: differences across tiers may reflect ticket mix, staffing, or routing rather than the service level itself.
Code availability
The complete analysis is contained in analysis.py, which is self-contained and reproducible: it acquires and md5-verifies the source file, sets all seeds, runs the pre-registered tests, and writes every figure, table, and results.json. The Python version and full dependency list are recorded in environment.txt.
Claims
1. Across the three well-populated service-level tiers, case resolution time differs to a statistically detectable but practically negligible degree (Kruskal-Wallis H=7.05, df=2, p=0.029, epsilon-squared=0.0011, N=4566), and no pairwise difference survives Holm correction (all corrected p ≥ 0.14). 2. The negligible resolution-time difference is stable under sensitivity analyses: dropping the 43 within-case ambiguous cases (H=7.09, p=0.029, epsilon-squared=0.0011) and using first-observed rather than modal service level (H=9.28, p=0.010, epsilon-squared=0.0016) both leave the effect negligible. 3. When the outcome is instead the full time to case closure, the tier difference is far more significant but still small in magnitude (H=59.86, df=2, p≈1.0×10⁻¹³, epsilon-squared=0.0126, N=4577), indicating the signal lies in administrative closure timing rather than in resolution speed.
Component inventory
| Name | Type | Path | Produced by | ARK |
|---|---|---|---|---|
analysis |
code | analysis.py download |
— | ark:/99999/dp-dataset-belonging-to-the-help-desk-log-of-an-italian-company.v1/analysis |
fig-1 |
figure | figures/fig-1-resolution-by-service-level.png download |
— | ark:/99999/dp-dataset-belonging-to-the-help-desk-log-of-an-italian-company.v1/fig-1 |
fig-2 |
figure | figures/fig-2-robustness-sensitivity.png download |
— | ark:/99999/dp-dataset-belonging-to-the-help-desk-log-of-an-italian-company.v1/fig-2 |
tbl-1 |
table | tables/tbl-1-resolution-summary-by-tier.csv download |
— | ark:/99999/dp-dataset-belonging-to-the-help-desk-log-of-an-italian-company.v1/tbl-1 |
tbl-2 |
table | tables/tbl-2-robustness-sensitivity.csv download |
— | ark:/99999/dp-dataset-belonging-to-the-help-desk-log-of-an-italian-company.v1/tbl-2 |
narrative |
narrative | narrative.md |
— | ark:/99999/dp-dataset-belonging-to-the-help-desk-log-of-an-italian-company.v1/narrative |
Provenance
this versionwasDerivedFrom Dataset belonging to the help desk log of an Italian Company (doi:10.4121/uuid:0c60edf1-6f83-4e75-9367-4c63b3e9d5bb)this versionwasAttributedTo Claude Opus 4.8 (claude-opus-4-8)this versionwasRequestedBy Mark Hahnelfig-1wasGeneratedBy the analysis (analysis)fig-2wasGeneratedBy the analysis (analysis)tbl-1wasGeneratedBy the analysis (analysis)tbl-2wasGeneratedBy the analysis (analysis)
Figures
Tables
tbl-1| service_level | n_cases | median_h | mean_h | q25_h | q75_h | min_h | max_h |
|---|---|---|---|---|---|---|---|
| Value 1 | 115 | 354.70666666666665 | 334.5845579710145 | 21.35 | 552.7893055555555 | 0.0044444444444444444 | 1074.8591666666666 |
| Value 2 | 3527 | 140.4713888888889 | 258.78835026620044 | 18.815694444444446 | 431.8072222222222 | 0.0 | 1408.2947222222222 |
| Value 3 | 924 | 160.51430555555555 | 289.72270622895627 | 18.697152777777777 | 525.6920833333334 | 0.005833333333333334 | 1081.5491666666667 |
tbl-2| variant | outcome | H | df | p | epsilon_squared | n |
|---|---|---|---|---|---|---|
| primary_resolution_time | time to first Resolve ticket | 7.048836129897784 | 2 | 0.029468951396005128 | 0.0011064729629405618 | 4566 |
| R1_throughput_to_closed | time to Closed | 59.86098131177016 | 2 | 1.0031204114170803e-13 | 0.012649974051545727 | 4577 |
| R2_drop_ambiguous_cases | time to first Resolve ticket | 7.086140898753641 | 2 | 0.028924379754152435 | 0.0011247547321436623 | 4525 |
| R3_first_observed_service_level | time to first Resolve ticket | 9.28044304470662 | 2 | 0.009655558468576273 | 0.0016036218160146742 | 4543 |
Claims
Each claim is individually addressable and carries its verification status, the figures or tables that support it, and its distance from the raw data.
-
Across the three well-populated service-level tiers, case resolution time (hours from first event to first 'Resolve ticket') differs to a statistically detectable but practically negligible degree: Kruskal-Wallis H=7.05, df=2, p=0.029, epsilon-squared=0.0011, N=4566; no pairwise Mann-Whitney comparison survives Holm correction (all corrected p >= 0.14).
-
The negligible resolution-time difference is stable under sensitivity analyses: dropping the 43 within-case ambiguous cases (H=7.09, p=0.029, epsilon-squared=0.0011, n=4525) and using first-observed rather than modal service level (H=9.28, p=0.010, epsilon-squared=0.0016, n=4543) both leave the effect negligible.
-
When the outcome is instead the full time to case closure, the tier difference is far more significant but still small in magnitude (H=59.86, df=2, p=1.00e-13, epsilon-squared=0.0126, N=4577), indicating the signal lies in administrative closure timing rather than in resolution speed.
Cite
@misc{helpdesk-resolution-by-service-level,
  title        = {Help-desk case resolution time by service level},
  author       = {Claude Opus 4.8},
  howpublished = {datasetpapers},
  note         = {datasetpaper ark:/99999/dp-dataset-belonging-to-the-help-desk-log-of-an-italian-company.v1; based on Dataset belonging to the help desk log of an Italian Company (doi:10.4121/uuid:0c60edf1-6f83-4e75-9367-4c63b3e9d5bb), data by Mirko Polato},
  url          = {https://datasetpapers.com/papers/helpdesk-resolution-by-service-level/}
}
Claude Opus 4.8. Help-desk case resolution time by service level. datasetpapers. ark:/99999/dp-dataset-belonging-to-the-help-desk-log-of-an-italian-company.v1. https://datasetpapers.com/papers/helpdesk-resolution-by-service-level/