The Test That Found Nothing
Run a standard test on this data — a Spearman correlation between how many penguins were nearby and how much prey a seabird caught — and you get nothing. Rho = 0.041, p = 0.760. Statistical noise.
That is close to what a first pass at this dataset concluded: no relationship between conspecific penguins and catch.
Run a different model on the exact same 57 bouts — one that treats catch as a rate, adjusted for how long each bout lasted — and prey-catch rate rises with every additional penguin present: rate ratio 1.030 per penguin (95% CI 1.004–1.057, p = 0.025). Same data, same predictor, opposite editorial conclusion.
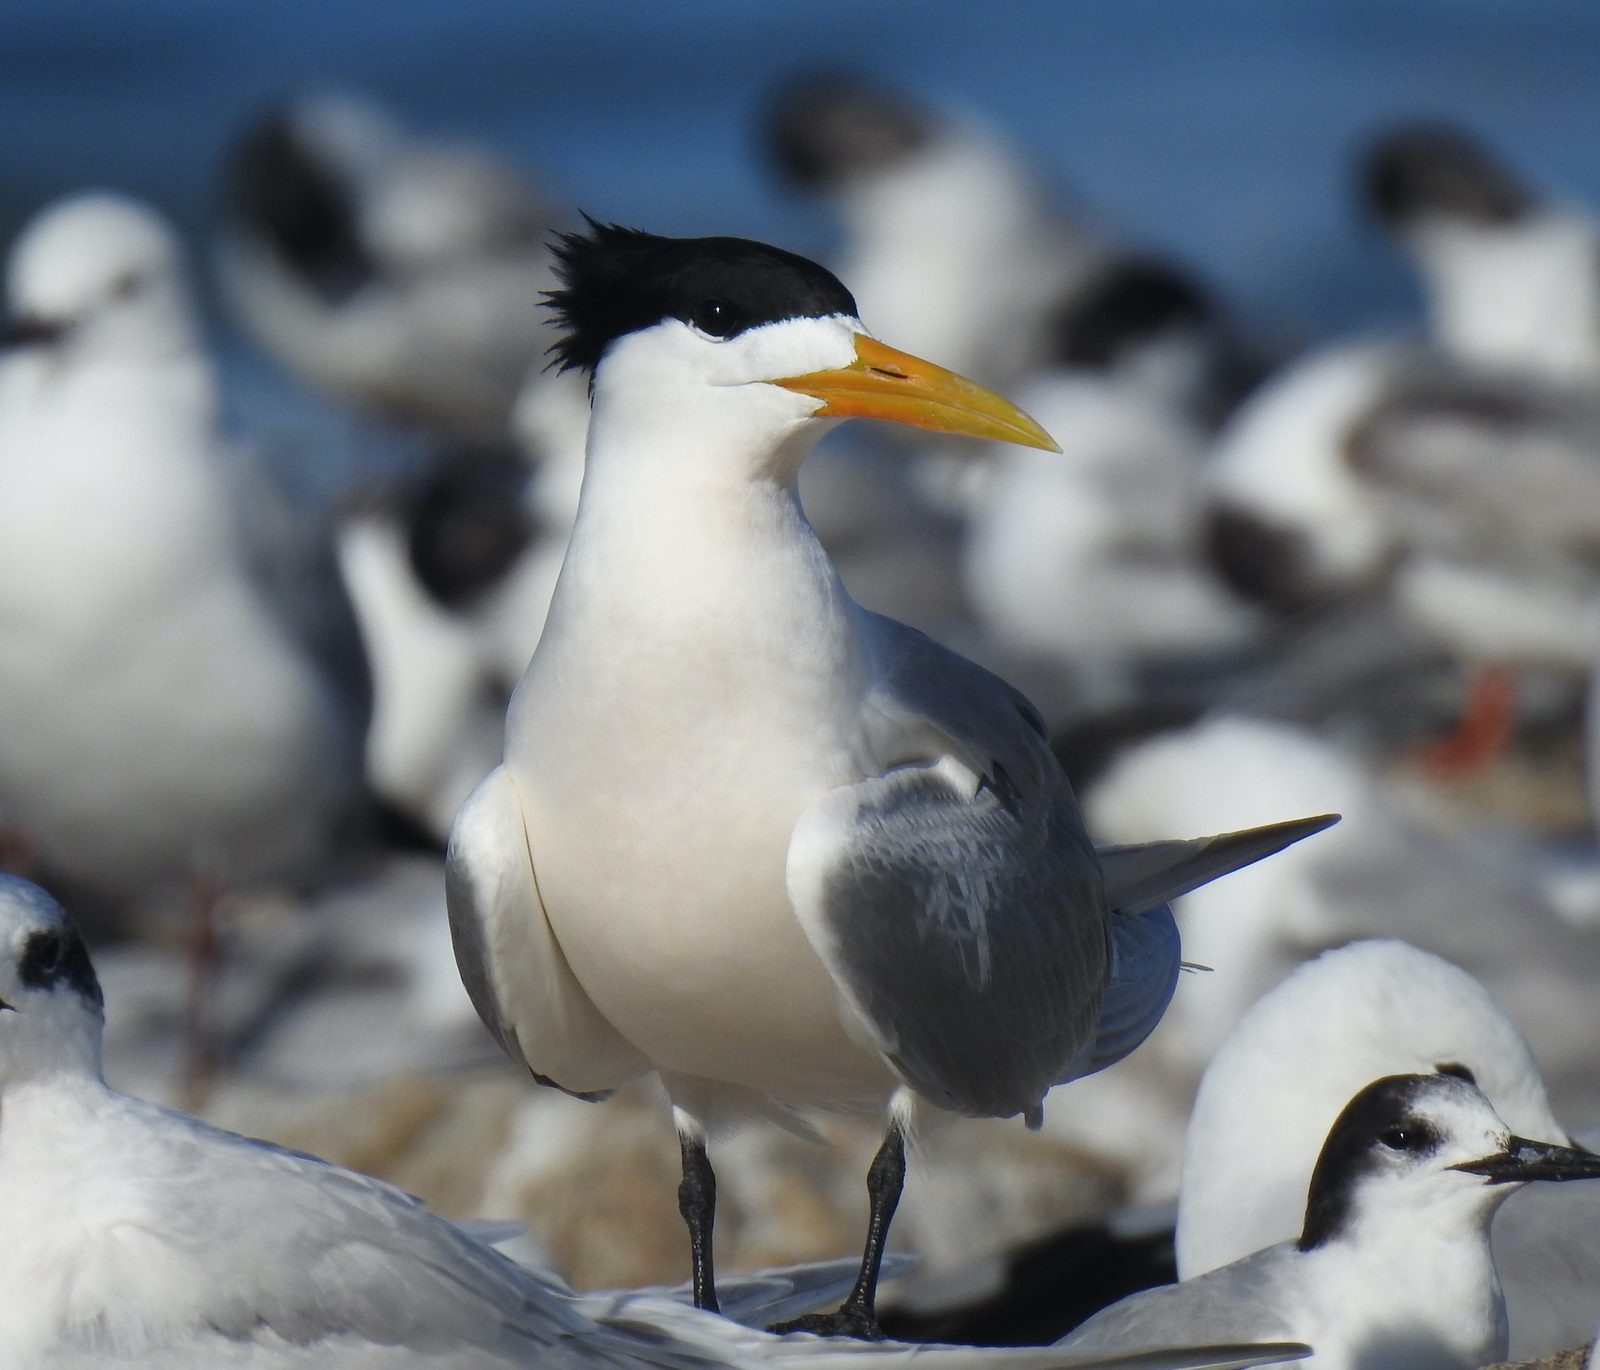
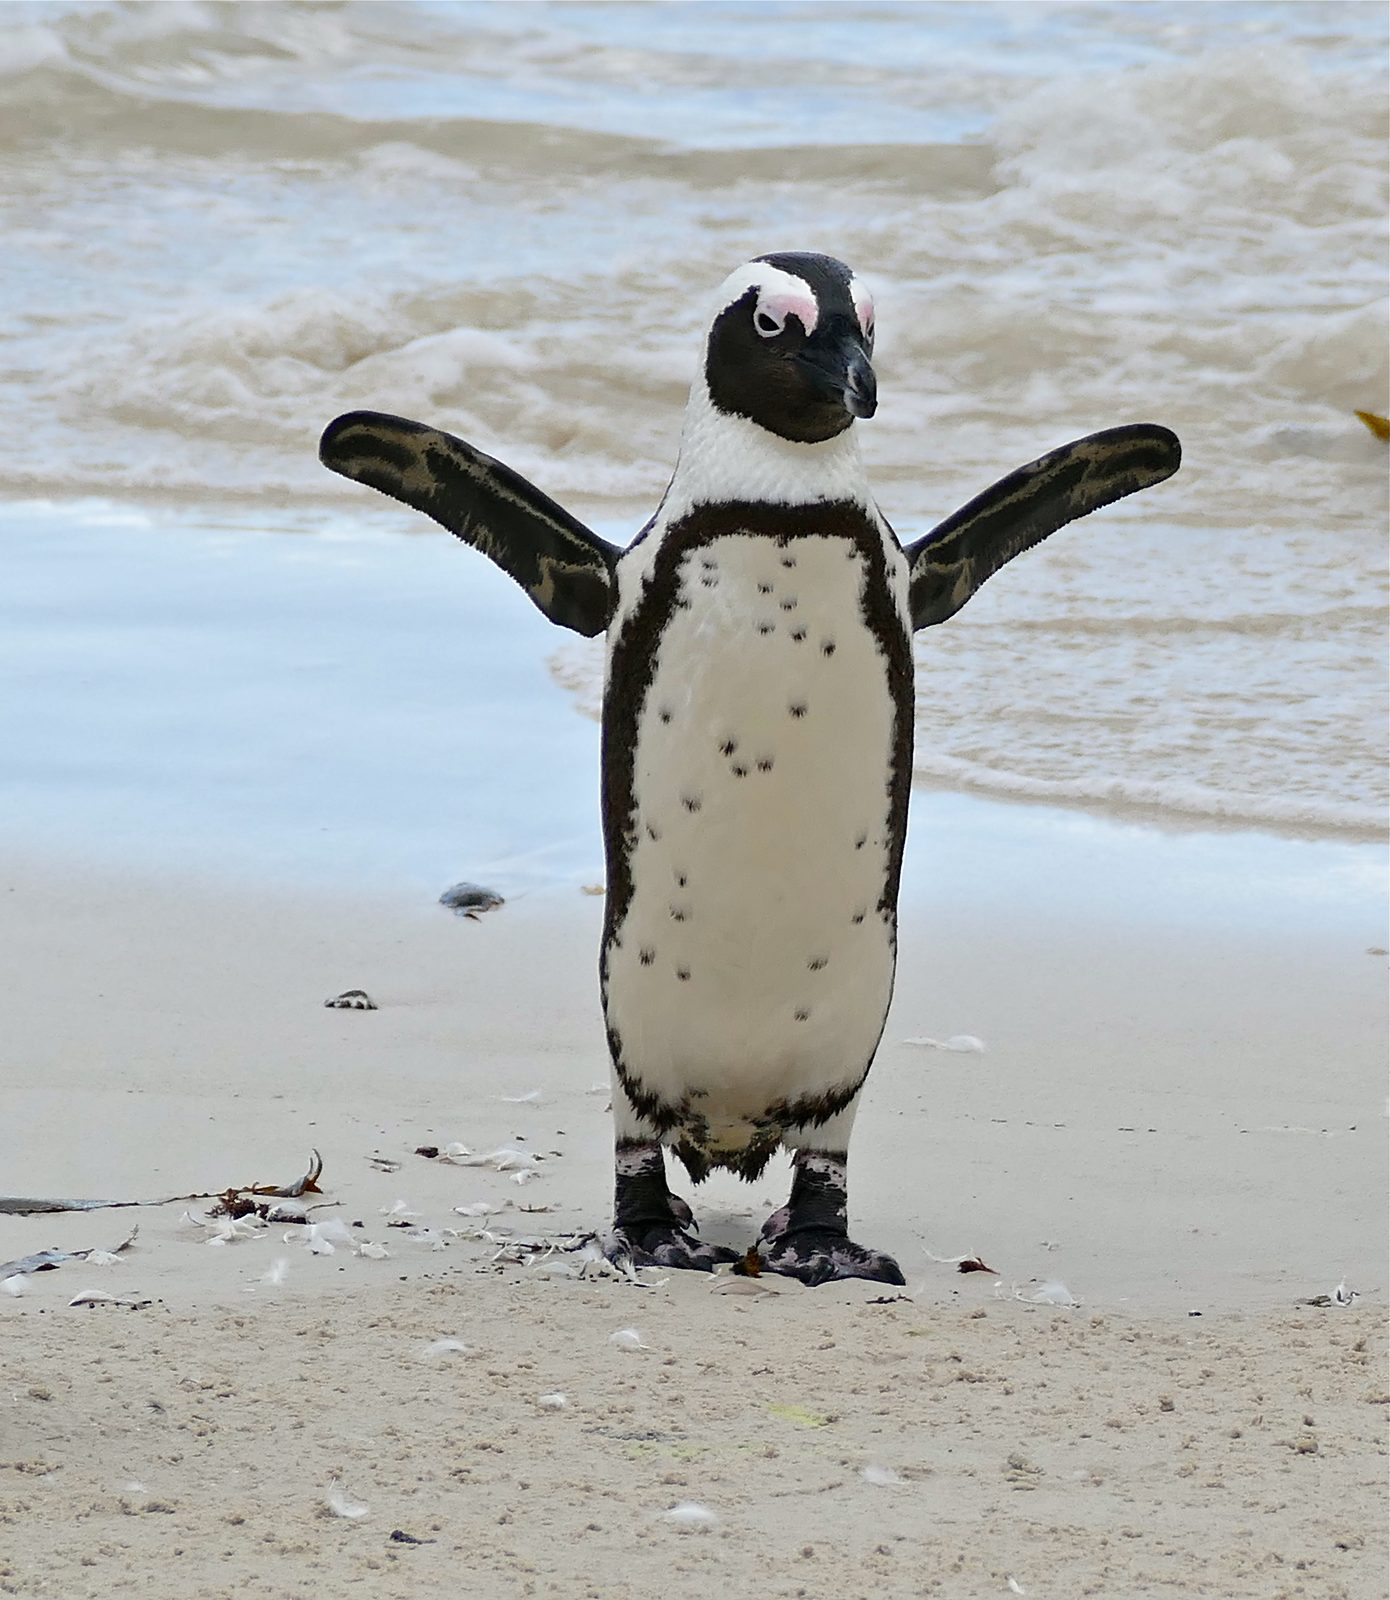
The birds in question are African penguins, tagged with animal-borne video cameras at Stony Point, South Africa, and the volant seabirds — terns, cormorants, petrels — that show up within 15 metres of a foraging penguin during its dive.
Nothing about the underlying biology changed between the two tests. What changed was whether the model accounted for exposure time — and that distinction turns out to be the whole story.
Cameras on Penguins
Between 2015 and 2018, researchers taped small video cameras to the backs of African penguins breeding at Stony Point, in South Africa's Benguela upwelling ecosystem, before they left on foraging trips, then retrieved the cameras when the penguins returned to their nests. Across 31 hours of footage from 20 tagged birds, 57 complete dive bouts captured a volant seabird — a tern, cormorant, or petrel — coming within 15 metres of the diving penguin.
After filtering to bouts with complete records, 19 of those birds and all 57 bouts enter this analysis, split 35 bouts in "surface" mode (the seabird on the water) to 22 in "flight" mode (the seabird airborne).
The title of the original study — "Up for grabs" — points at the mechanism under investigation: volant seabirds like terns and cormorants cannot dive more than a few metres, so prey schools sitting deeper than roughly 30–40 metres are normally out of reach. In the original video footage, 70% of prey-pursuit sequences involved fish that had just been pushed up from below 33 metres, and in 7 of 10 cases where both species caught the same prey school, the school had been herded into shallow water before the volant seabird moved in.
That is the textbook definition of ecological facilitation: one species making a resource accessible to another, distinct from kleptoparasitism (stealing an already-caught meal) or straightforward competition for the same fish.
It is not a novel arrangement in seabird ecology. Studies of North Sea feeding flocks describe a similar division of labour: black-legged kittiwakes spot a prey patch and draw others in, while diving guillemots and razorbills act as the "producers" that physically push fish upward for the surface-feeders to exploit. Penguins and volant seabirds, on this reading, are playing the same two roles.

The Hidden Confound
Bout duration ("elapsed") ranges from 28 seconds to 2,278 seconds — an 81-fold spread — with a median of 253 seconds. Because catch is a count that accumulates over however long the bout happens to run, a longer bout has more opportunity to rack up catches almost by accident.
The confound is not hypothetical here: bout duration correlates negatively with the number of conspecific penguins present (Spearman rho = -0.338, p = 0.010). Bouts with more than two penguins nearby last a median of 191 seconds; bouts with two or fewer last a median of 327 seconds. Put plainly, bouts with more penguins around tend to get cut short.
That is exactly backwards from what a raw-count test needs to see a facilitation signal: high-conspecific bouts have less time to accumulate a visibly higher raw count, even if prey are being caught faster per second. Divide by duration, and the suppression disappears — which is exactly what separates edt_01's two tests.
Three Percent, Compounding
The primary model — a Poisson generalised estimating equation with a log-duration offset, clustering repeated bouts by bird — puts the conspecific effect at a rate ratio of 1.030 per additional penguin (95% CI 1.004–1.057, p = 0.025). A 3% rise per penguin sounds modest, but it compounds across the observed range: the fitted surface-mode catch rate climbs from about 18.5 catches per 1,000 seconds with no penguins present to about 53.4 per 1,000 seconds at 36 penguins — roughly 2.9 times higher.
A simpler, model-free view tells a similar story: splitting bouts into low (0–1), mid (2–8), and high (9+) conspecific bands, the high band's median catch rate (51.8 per 1,000s) is roughly three to six times the low and mid bands (16.1 and 9.2 per 1,000s) — though the dip from low to mid, rather than a clean climb, is a reminder this is a noisy pattern on 57 bouts, not a smooth dose-response curve.
The effect is not equally strong everywhere it is tested. Aggregated to one value per bird — removing the repeated-bout structure entirely — it strengthens sharply (rate ratio 1.046, p = 6.0×10⁻⁸ across 19 birds). But under a negative-binomial model that does not cluster by bird, it weakens to a rate ratio of 1.022 and loses significance (p = 0.145).
That split verdict is consistent with facilitation being real but modest against a noisy background — not an effect that survives every possible way of slicing the same 57 bouts, but one that keeps reappearing when the repeated-bird structure is respected.
Correcting for testing both the mode and conspecific hypotheses together nudges the conspecific effect's p-value from 0.025 to 0.050 — landing it right at the conventional significance boundary once multiple comparisons are accounted for.
The Other Null, and Why It Isn't Proof of Nothing
The same model finds no clear effect of interaction mode: flight-mode bouts show a catch rate 1.21 times that of surface-mode bouts, but the 95% CI runs from 0.64 to 2.30, and the effect is not significant (p = 0.557).
A naive Mann-Whitney test on raw catch counts, ignoring duration entirely, agrees: p = 0.850, essentially no difference. Unlike the conspecific-number result, adjusting for exposure time does not flip the conclusion for mode.
It would be tempting to read that as "mode doesn't matter." The data will not support that claim either. A formal equivalence test — asking whether the mode effect is small enough (within a 1.5× rate-ratio margin either way) to call negligible — fails to establish equivalence (TOST p = 0.256).
The honest reading, which the original authors themselves flagged as an open question, is that 57 bouts simply cannot distinguish "no effect" from "an effect too small for this sample to detect." The 95% CI (0.64 to 2.30) still allows anywhere from a 36% decrease to a 130% increase in catch rate for flight versus surface — the data cannot currently say which.
One Bird, One Third of the Data
The 57 bouts are not evenly spread across the 19 tagged birds. One bird, deployed on 22 August 2018, alone contributes 21 of the 57 bouts — 36.8% of the entire dataset from a single individual's single day. Seven of the 19 birds contribute exactly one bout each.
That concentration is not spread evenly across field seasons either: the 2018 season's 21 bouts all come from that same one bird, while 2015–2017 each drew on four to seven different individuals.
This is precisely why the primary model clusters standard errors by bird ID rather than treating all 57 bouts as independent — without that correction, one bird's unusually active day could pass for a population-level pattern.
The conspecific-number variable itself is heavily skewed: 42.1% of bouts have at most one penguin present, and only 19.3% have ten or more. The "per-penguin" rate ratio is therefore estimated mostly from the low end of the range, with a comparatively thin scatter of high-conspecific bouts anchoring the top of the fitted curve.
Catch itself is uneven too: 21.1% of bouts end with nothing caught at all, while the single highest-catch bout — 85 prey items in 1,344 seconds, with 13 penguins present — is nearly ten times the dataset's median catch of 3.
What Rides on the Penguins
African penguins were uplisted to Critically Endangered by the IUCN in October 2024, their breeding population down from roughly 141,000 pairs in the 1950s to about 9,900 pairs by 2023 — a 93% collapse, driven largely by commercial fishing depleting the small schooling fish both penguins and their facilitation partners depend on.
If penguins really do function as unwitting "beaters" that push deep-schooling prey into reach of terns, cormorants, and petrels, the original study's authors were careful to note what this analysis still cannot resolve: whether the penguin comes out ahead in that exchange, or simply loses part of its catch to faster surface feeders once the prey is herded up.
Continued penguin decline would not just be a loss for the penguins. If this pattern holds, it would strip away a foraging subsidy an unknown number of other seabirds along this coast may be quietly relying on — a question this data was never designed to answer, but one its central finding makes considerably harder to ignore.