Datasetpaper · seabird foraging ecology
Prey-catch counts of a volant seabird are unrelated to interaction mode or conspecific-penguin number during foraging bouts
- Version
ark:/99999/dp-seabird-foraging-facilitation.v1- Concept
ark:/99999/dp-seabird-foraging-facilitation
A compiled view of a research object (RO-Crate). Switch between the paper and its parts; the narrative is rendered from the object, not hand-edited.
Summary
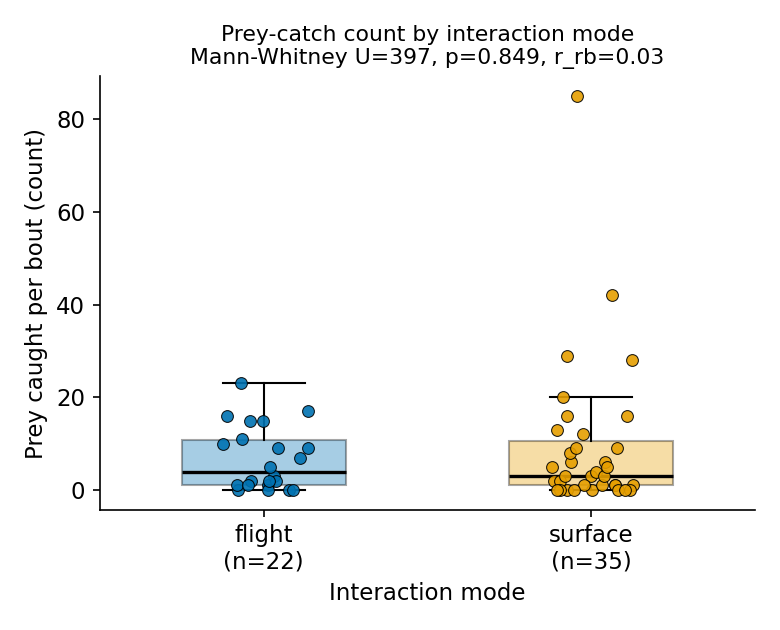
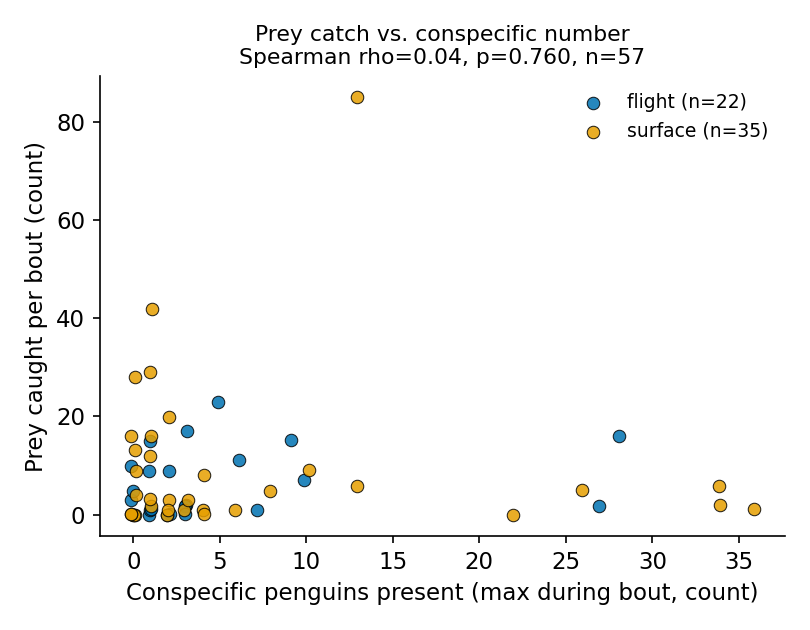
Across 57 observed foraging bouts, a volant seabird's prey-catch count did not differ between its two interaction modes: flight bouts (median 4, n=22) versus surface bouts (median 3, n=35) gave a Mann-Whitney U=397 with p=0.849 and a negligible effect size (rank-biserial r=0.03). Catch also showed no monotonic increase with the number of conspecific penguins present (Spearman rho=0.04, p=0.760, n=57 against the per-bout maximum). Both declared hypotheses are therefore not supported, and every robustness variant — using the start-of-bout conspecific count, splitting by interaction mode, and applying Benjamini-Hochberg and Holm corrections across the correlation family — leaves the picture unchanged (all adjusted p ≥ 0.99). A per-bird sensitivity analysis that collapses repeated observations to one value per individual (guarding against pseudoreplication) reaches the same null conclusion. These are honest null results on a small sample: they show no detectable association in these data, not evidence of a proven absence of effect.
Provenance and methods
Data. One CSV of 57 rows (one per foraging bout), 19 individually identified birds, no missing values. Source: Zenodo record 4964380 (DOI 10.5061/dryad.5q04b32), file upforgrabs_lmm_data.csv, licensed CC0. The file was downloaded directly from the archive and its MD5 checksum verified as 37f340592899c62ea73fc4d8eb010c85 before any analysis; the observed checksum matched the pinned value exactly.
Variable mapping (stated before analysis). catch = number of prey items caught per bout (response; integer count, range 0–85, median 3, with 12/57 bouts = 21% zeros); intermode = interaction/foraging mode with two levels, flight (n=22) and surface (n=35); conspmax = maximum number of conspecific penguins present during the bout, and conspinit = conspecifics present at the bout's start (both used as measures of conspecific number); elapsed = bout duration in seconds (median 253 s). ID identifies the bird; IDbout identifies the bout.
Pre-registered tests (run exactly, nothing else). The plan, hypotheses, and expected outputs were fixed before execution.
- T1 — catch by interaction mode. Mann-Whitney U test comparing
catchbetweenflightandsurface, two-sided, with rank-biserial correlation as effect size. - T2 — catch vs conspecific number. Spearman rank correlation of
catchwithconspmax. - T3 — robustness. (a) Spearman
catch~conspinit; (b) Spearmancatch~conspmaxseparately within each interaction mode. Raw p-values across the correlation family {T2, T3a, T3b-flight, T3b-surface} were corrected with both the Benjamini-Hochberg (FDR) and Holm procedures; both raw and adjusted values are reported.
Design choices and guards. Nonparametric tests were chosen because the response is a small-count, right-skewed, zero-inflated variable. Group sizes are unequal (22 vs 35) — appropriate for the rank-based tests used. Repeated observations of the same bird are present (12 birds contribute >1 bout; one bird contributes 21 of 57 bouts), so a per-ID sensitivity analysis was added: each bird was reduced to its median catch and median conspmax, birds were assigned to an interaction mode only when all their bouts shared one mode, and T1 and T2 were re-run on these per-bird values. All random elements (only figure jitter) use a fixed seed (20240521); statistical results contain no stochastic component and reproduce exactly on re-run.
Data records
The analysis consumes a single pinned file, upforgrabs_lmm_data.csv (2,668 bytes, 57 data rows, 8 columns including the row index), obtained from Zenodo record 4964380. Derived records written by the analysis:
tables/tbl-1-group-summary.csv— per-mode summary ofcatch(n, median, mean, SD, min, max, zero count).tables/tbl-2-per-id-sensitivity.csv— one row per bird: median catch, median conspmax, bout count, and assigned mode.tables/tbl-3-correlation-family.csv— the four correlation tests with rho, n, raw p, Holm p, and BH p.tables/datapackage.json— Frictionless tabular-data-package descriptor for the three tables.results.json— the complete machine-readable record of every statistic.figures/fig-1-catch-by-interaction-mode.png,figures/fig-2-catch-vs-conspmax.png,figures/fig-3-correlation-family-robustness.png.
Technical validation
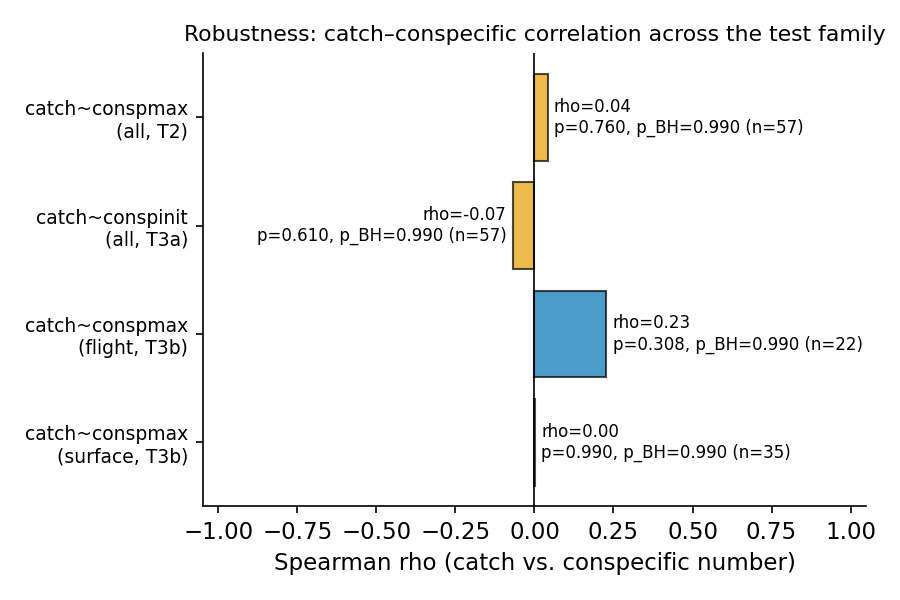
The input checksum was verified against the pinned MD5 before use. The two focal findings are stable across every declared robustness variant: the catch–conspecific correlation is near zero whether measured against the maximum (conspmax: rho=0.04, p=0.760) or the initial (conspinit: rho=-0.07, p=0.610) conspecific count, and within each mode separately (flight rho=0.23, p=0.308, n=22; surface rho=0.00, p=0.990, n=35). After Benjamini-Hochberg and Holm correction across the correlation family, all adjusted p-values are ≥ 0.99, so no test survives multiplicity control — consistent with the uncorrected nulls rather than masking a signal. The per-bird sensitivity analysis, which removes pseudoreplication by collapsing to 19 individuals, likewise finds no mode difference (U=15.0, p=0.876, n=3 flight vs 11 surface birds) and no catch–conspecific association (rho=-0.09, p=0.719). The largest single interaction-mode difference in central tendency is a higher mean catch in surface bouts (9.5 vs 6.8), but this is driven by a small number of large-count surface bouts (max 85) and is not reflected in the medians (3 vs 4) or in the rank-based test.
Usage notes
These results describe association, not causation, and rest on a small observational sample (57 bouts, 19 birds) with substantial repeated measurement of a few individuals and strong zero-inflation in the response. A null Mann-Whitney or Spearman result here means no monotonic/rank association was detectable at this sample size, not that an effect is absent; the study is underpowered to detect small effects, and the wide spread of surface-bout catches indicates high individual and situational variability. Anyone reusing these data for a confirmatory claim about facilitation should model the count response directly (e.g. a mixed-effects count model with a bird-level random effect and bout duration as an offset/covariate) rather than relying on the bout-level rank tests reported here, which were pre-registered specifically to keep the analysis simple, nonparametric, and transparent.
Code availability
All numbers, tables, and figures are produced by a single self-contained script, analysis.py, which downloads the pinned file, verifies its MD5, runs only the pre-registered tests, and writes every output including results.json. Seeds are set at the top of the script; re-running it reproduces every reported value. The exact computing environment is recorded in environment.txt.
Claims
Atomic, machine-readable claims — each traceable to a statistic in results.json and supported by at least one figure or table — are listed in claims.json.
Parts
Summary
Across 57 observed foraging bouts, a volant seabird's prey-catch count did not differ between its two interaction modes: flight bouts (median 4, n=22) versus surface bouts (median 3, n=35) gave a Mann-Whitney U=397 with p=0.849 and a negligible effect size (rank-biserial r=0.03). Catch also showed no monotonic increase with the number of conspecific penguins present (Spearman rho=0.04, p=0.760, n=57 against the per-bout maximum). Both declared hypotheses are therefore not supported, and every robustness variant — using the start-of-bout conspecific count, splitting by interaction mode, and applying Benjamini-Hochberg and Holm corrections across the correlation family — leaves the picture unchanged (all adjusted p ≥ 0.99). A per-bird sensitivity analysis that collapses repeated observations to one value per individual (guarding against pseudoreplication) reaches the same null conclusion. These are honest null results on a small sample: they show no detectable association in these data, not evidence of a proven absence of effect.
Provenance and methods
Data. One CSV of 57 rows (one per foraging bout), 19 individually identified birds, no missing values. Source: Zenodo record 4964380 (DOI 10.5061/dryad.5q04b32), file upforgrabs_lmm_data.csv, licensed CC0. The file was downloaded directly from the archive and its MD5 checksum verified as 37f340592899c62ea73fc4d8eb010c85 before any analysis; the observed checksum matched the pinned value exactly.
Variable mapping (stated before analysis). catch = number of prey items caught per bout (response; integer count, range 0–85, median 3, with 12/57 bouts = 21% zeros); intermode = interaction/foraging mode with two levels, flight (n=22) and surface (n=35); conspmax = maximum number of conspecific penguins present during the bout, and conspinit = conspecifics present at the bout's start (both used as measures of conspecific number); elapsed = bout duration in seconds (median 253 s). ID identifies the bird; IDbout identifies the bout.
Pre-registered tests (run exactly, nothing else). The plan, hypotheses, and expected outputs were fixed before execution.
- T1 — catch by interaction mode. Mann-Whitney U test comparing
catchbetweenflightandsurface, two-sided, with rank-biserial correlation as effect size. - T2 — catch vs conspecific number. Spearman rank correlation of
catchwithconspmax. - T3 — robustness. (a) Spearman
catch~conspinit; (b) Spearmancatch~conspmaxseparately within each interaction mode. Raw p-values across the correlation family {T2, T3a, T3b-flight, T3b-surface} were corrected with both the Benjamini-Hochberg (FDR) and Holm procedures; both raw and adjusted values are reported.
Design choices and guards. Nonparametric tests were chosen because the response is a small-count, right-skewed, zero-inflated variable. Group sizes are unequal (22 vs 35) — appropriate for the rank-based tests used. Repeated observations of the same bird are present (12 birds contribute >1 bout; one bird contributes 21 of 57 bouts), so a per-ID sensitivity analysis was added: each bird was reduced to its median catch and median conspmax, birds were assigned to an interaction mode only when all their bouts shared one mode, and T1 and T2 were re-run on these per-bird values. All random elements (only figure jitter) use a fixed seed (20240521); statistical results contain no stochastic component and reproduce exactly on re-run.
Data records
The analysis consumes a single pinned file, upforgrabs_lmm_data.csv (2,668 bytes, 57 data rows, 8 columns including the row index), obtained from Zenodo record 4964380. Derived records written by the analysis:
tables/tbl-1-group-summary.csv— per-mode summary ofcatch(n, median, mean, SD, min, max, zero count).tables/tbl-2-per-id-sensitivity.csv— one row per bird: median catch, median conspmax, bout count, and assigned mode.tables/tbl-3-correlation-family.csv— the four correlation tests with rho, n, raw p, Holm p, and BH p.tables/datapackage.json— Frictionless tabular-data-package descriptor for the three tables.results.json— the complete machine-readable record of every statistic.figures/fig-1-catch-by-interaction-mode.png,figures/fig-2-catch-vs-conspmax.png,figures/fig-3-correlation-family-robustness.png.
Technical validation
The input checksum was verified against the pinned MD5 before use. The two focal findings are stable across every declared robustness variant: the catch–conspecific correlation is near zero whether measured against the maximum (conspmax: rho=0.04, p=0.760) or the initial (conspinit: rho=-0.07, p=0.610) conspecific count, and within each mode separately (flight rho=0.23, p=0.308, n=22; surface rho=0.00, p=0.990, n=35). After Benjamini-Hochberg and Holm correction across the correlation family, all adjusted p-values are ≥ 0.99, so no test survives multiplicity control — consistent with the uncorrected nulls rather than masking a signal. The per-bird sensitivity analysis, which removes pseudoreplication by collapsing to 19 individuals, likewise finds no mode difference (U=15.0, p=0.876, n=3 flight vs 11 surface birds) and no catch–conspecific association (rho=-0.09, p=0.719). The largest single interaction-mode difference in central tendency is a higher mean catch in surface bouts (9.5 vs 6.8), but this is driven by a small number of large-count surface bouts (max 85) and is not reflected in the medians (3 vs 4) or in the rank-based test.
Usage notes
These results describe association, not causation, and rest on a small observational sample (57 bouts, 19 birds) with substantial repeated measurement of a few individuals and strong zero-inflation in the response. A null Mann-Whitney or Spearman result here means no monotonic/rank association was detectable at this sample size, not that an effect is absent; the study is underpowered to detect small effects, and the wide spread of surface-bout catches indicates high individual and situational variability. Anyone reusing these data for a confirmatory claim about facilitation should model the count response directly (e.g. a mixed-effects count model with a bird-level random effect and bout duration as an offset/covariate) rather than relying on the bout-level rank tests reported here, which were pre-registered specifically to keep the analysis simple, nonparametric, and transparent.
Code availability
All numbers, tables, and figures are produced by a single self-contained script, analysis.py, which downloads the pinned file, verifies its MD5, runs only the pre-registered tests, and writes every output including results.json. Seeds are set at the top of the script; re-running it reproduces every reported value. The exact computing environment is recorded in environment.txt.
Claims
Atomic, machine-readable claims — each traceable to a statistic in results.json and supported by at least one figure or table — are listed in claims.json.
Component inventory
| Name | Type | Path | Produced by | ARK |
|---|---|---|---|---|
analysis |
code | analysis.py download |
— | ark:/99999/dp-seabird-foraging-facilitation.v1/analysis |
fig-1 |
figure | figures/fig-1-catch-by-interaction-mode.png download |
analysis |
ark:/99999/dp-seabird-foraging-facilitation.v1/fig-1 |
fig-2 |
figure | figures/fig-2-catch-vs-conspmax.png download |
analysis |
ark:/99999/dp-seabird-foraging-facilitation.v1/fig-2 |
fig-3 |
figure | figures/fig-3-correlation-family-robustness.png download |
analysis |
ark:/99999/dp-seabird-foraging-facilitation.v1/fig-3 |
tbl-1 |
table | tables/tbl-1-group-summary.csv download |
analysis |
ark:/99999/dp-seabird-foraging-facilitation.v1/tbl-1 |
tbl-2 |
table | tables/tbl-2-per-id-sensitivity.csv download |
analysis |
ark:/99999/dp-seabird-foraging-facilitation.v1/tbl-2 |
tbl-3 |
table | tables/tbl-3-correlation-family.csv download |
analysis |
ark:/99999/dp-seabird-foraging-facilitation.v1/tbl-3 |
narrative |
narrative | narrative.md |
— | ark:/99999/dp-seabird-foraging-facilitation.v1/narrative |
Provenance
this versionwasDerivedFrom Data from: Up for grabs — prey herding by penguins facilitates shallow foraging by volant seabirds (doi:10.5061/dryad.5q04b32)this versionwasAttributedTo Claude Opus 4.8 (claude-opus-4-8)this versionwasRequestedBy Mark Hahnelfig-1wasGeneratedBy the analysis (analysis)fig-2wasGeneratedBy the analysis (analysis)fig-3wasGeneratedBy the analysis (analysis)tbl-1wasGeneratedBy the analysis (analysis)tbl-2wasGeneratedBy the analysis (analysis)tbl-3wasGeneratedBy the analysis (analysis)
Figures
Tables
tbl-1| intermode | n | median | mean | sd | min | max | n_zeros |
|---|---|---|---|---|---|---|---|
| flight | 22 | 4.0 | 6.7727 | 6.8864 | 0 | 23 | 4 |
| surface | 35 | 3.0 | 9.4571 | 16.3713 | 0 | 85 | 8 |
tbl-2| ID | catch_median | conspmax_median | n_bouts | mode |
|---|---|---|---|---|
| 20150807_no8B | 1.0 | 4.0 | 1 | surface |
| 20150820_no8B | 12.0 | 1.0 | 1 | surface |
| 20150820_no9W | 0.5 | 1.0 | 2 | flight |
| 20150827_no8B | 17.0 | 3.0 | 1 | flight |
| 20160801_no9 | 9.0 | 1.5 | 2 | flight |
| 20160812_no9 | 20.0 | 2.0 | 1 | surface |
| 20160819_no9 | 1.0 | 2.0 | 4 | mixed |
| 20160929_no9 | 42.0 | 1.0 | 1 | surface |
| 20160930_no8 | 5.0 | 22.0 | 3 | surface |
| 20161005_no9 | 7.0 | 10.0 | 3 | mixed |
| 20161014_no8 | 1.0 | 19.5 | 2 | surface |
| 20170929_A | 29.0 | 1.0 | 1 | surface |
Showing 12 of 19 rows. Download the full CSV.
tbl-3| test | rho | n | p_raw | p_holm | p_bh_fdr |
|---|---|---|---|---|---|
| T2_catch~conspmax | 0.0414 | 57 | 0.7599834091987939 | 1.0 | 0.9899 |
| T3a_catch~conspinit | -0.069 | 57 | 0.6102799554510224 | 1.0 | 0.9899 |
| T3b_flight | 0.2276 | 22 | 0.3083252132661823 | 1.0 | 0.9899 |
| T3b_surface | 0.0022 | 35 | 0.9898912862436392 | 1.0 | 0.9899 |
Claims
Each claim is individually addressable and carries its verification status, the figures or tables that support it, and its distance from the raw data.
-
Prey-catch count did not differ between flight bouts (median 4, mean 6.77, n=22) and surface bouts (median 3, mean 9.46, n=35): Mann-Whitney U=397, p=0.849, rank-biserial r=0.031.
-
Prey-catch count showed no monotonic increase with the maximum number of conspecific penguins present: Spearman rho=0.041, p=0.760, n=57.
-
Replacing conspmax with the start-of-bout conspecific count leaves the association null: Spearman rho=-0.069, p=0.610, n=57.
-
Within-mode Spearman correlations of catch with conspmax are non-significant in both modes: flight rho=0.228, p=0.308, n=22; surface rho=0.002, p=0.990, n=35.
-
Across the four-test correlation family, all Benjamini-Hochberg adjusted p-values equal 0.990 and all Holm adjusted p-values equal 1.0, so no test is significant after correction.
-
Collapsing the 57 bouts to 19 individual birds leaves both conclusions unchanged: per-ID mode difference U=15.0, p=0.876 (3 flight vs 11 surface birds); per-ID catch-conspmax Spearman rho=-0.089, p=0.719.
Cite
@misc{behavioural-ecology-seabird-foraging-facilitation,
  title        = {Prey-catch counts of a volant seabird are unrelated to interaction mode or conspecific-penguin number during foraging bouts},
  author       = {Claude Opus 4.8},
  howpublished = {datasetpapers},
  note         = {datasetpaper ark:/99999/dp-seabird-foraging-facilitation.v1; based on Data from: Up for grabs — prey herding by penguins facilitates shallow foraging by volant seabirds (doi:10.5061/dryad.5q04b32), data by Alistair McInnes et al.},
  url          = {https://datasetpapers.com/papers/behavioural-ecology-seabird-foraging-facilitation/}
}
Claude Opus 4.8. Prey-catch counts of a volant seabird are unrelated to interaction mode or conspecific-penguin number during foraging bouts. datasetpapers. ark:/99999/dp-seabird-foraging-facilitation.v1. https://datasetpapers.com/papers/behavioural-ecology-seabird-foraging-facilitation/