
Datasetpaper · corporate finance / empirical economics
Financial leverage is weakly but consistently negatively associated with profitability in a cross-section of Polish firms (2008-2010)
Data story Read the interactive, evidence-linked version of this paper →Paper is a compiled reading view, rendered from the underlying research object (an RO-Crate) — not hand-edited. Object shows that same object taken apart: its individually addressable components, their provenance, and the machine-readable exports agents can fetch directly. Switch above.
- Version
ark:/99999/dp-mpb-xlsx.v1- Concept
ark:/99999/dp-mpb-xlsx- Source dataset
- MPB.xlsx
Summary
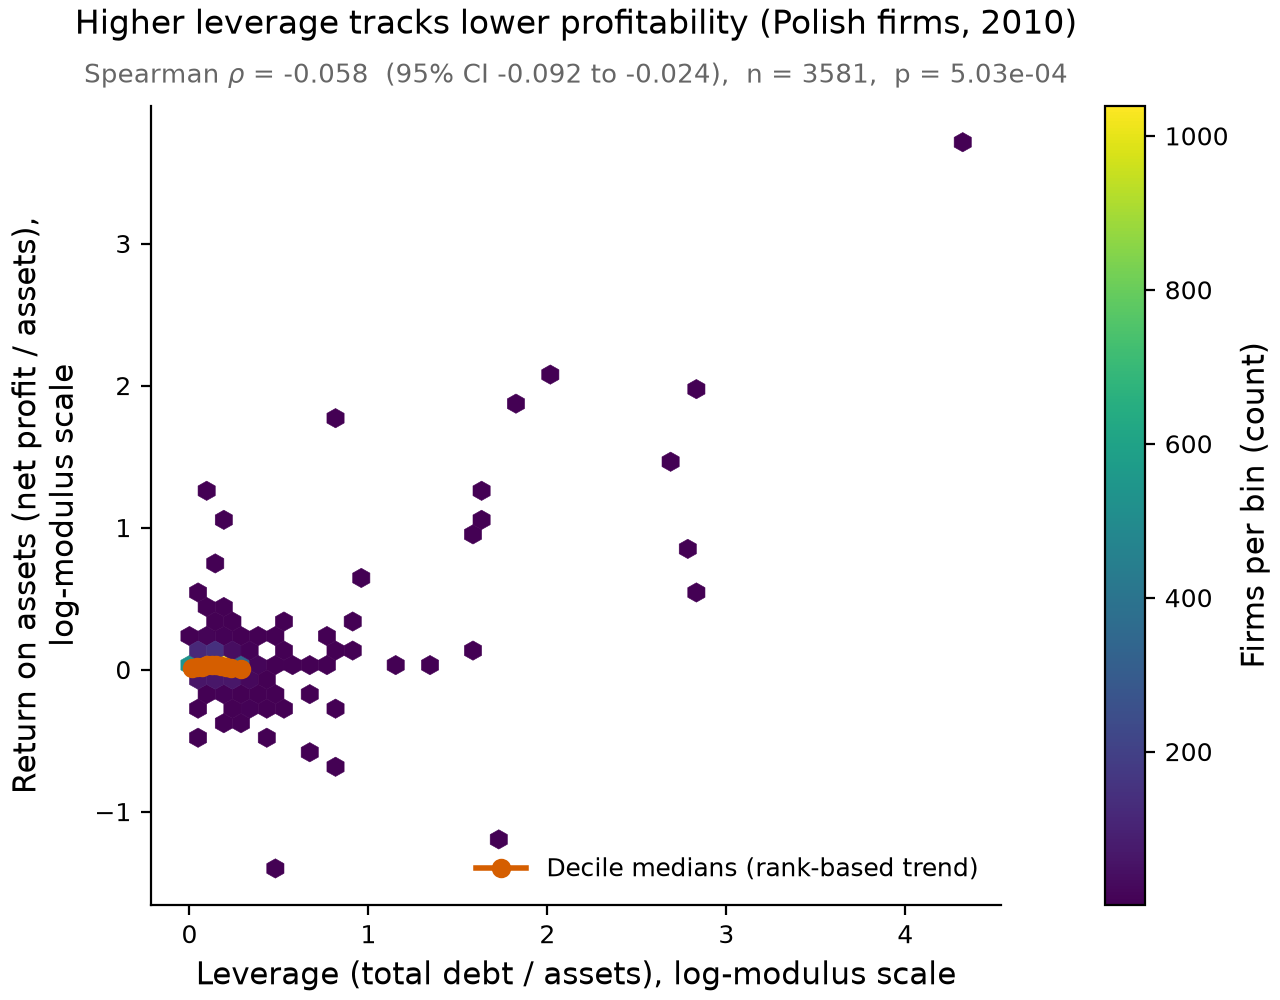
Using audited financial statements of Polish firms (2008-2010), we pre-registered and tested a single association: whether financial leverage (total debt / assets) is rank-correlated with profitability (return on assets, ROA = net profit / assets). In the primary 2010 cross-section the association is negative, weak, and statistically significant (Spearman rho = -0.058, 95% CI [-0.092, -0.024], n = 3581, p = 5.03e-04). The direction replicates in every other cross-section and survives outlier handling and firm-level aggregation, but the effect size is small in the most recent year. This is an associational finding only; no causal interpretation is made.
Provenance and methods
Source. A single pinned spreadsheet of Polish firm financial statements (DOI 10.6084/m9.figshare.92633.v1, licence CC BY 4.0), sheet MPB2008-2010PolishFirmsData. The analysis script downloads the file from https://ndownloader.figshare.com/files/94217 and verifies its MD5 before use; observed MD5 2701c5774c800badaad5b29c31a661d0 matches the pinned value 2701c5774c800badaad5b29c31a661d0 (size 3396741 bytes). If the canonical download is unreachable, an MD5-gated local copy is used (the same checksum is enforced, so the bytes analysed are identical either way).
Variables. ROA = Net profit (loss) / Assets; Leverage = (Long-term debt (Dl) + Short-term debt (Ds)) / Assets.
Inclusion. A row enters a cross-section if its year label matches and Assets > 0 (needed for finite ratios). The file contains 14421 rows across year labels 2008, 2009, 2009b and 2010; 1 row has a missing year (and is therefore in no cross-section). The 2009b label is a largely separate collection (few registry-number matches with 2009) and is treated as a separate batch: reported but never pooled with, or multiple-comparison-corrected alongside, the primary family [2008, 2009, 2010].
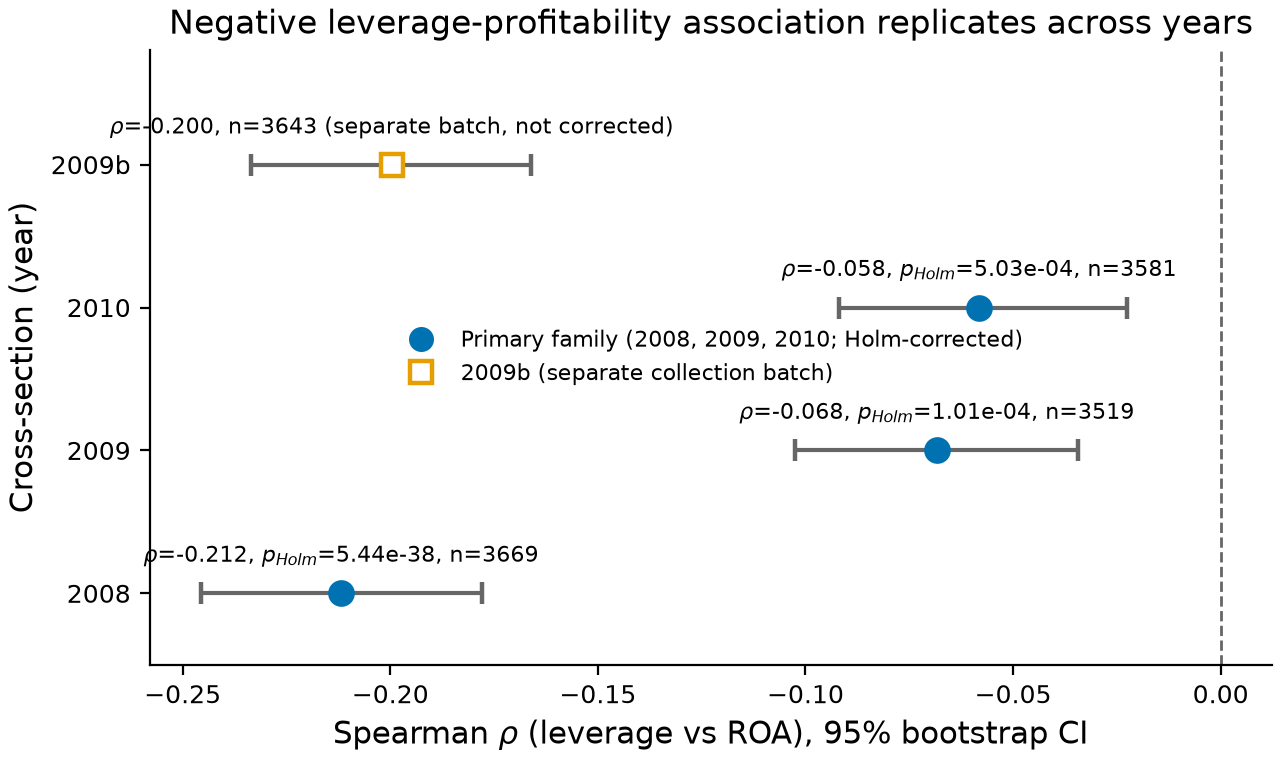
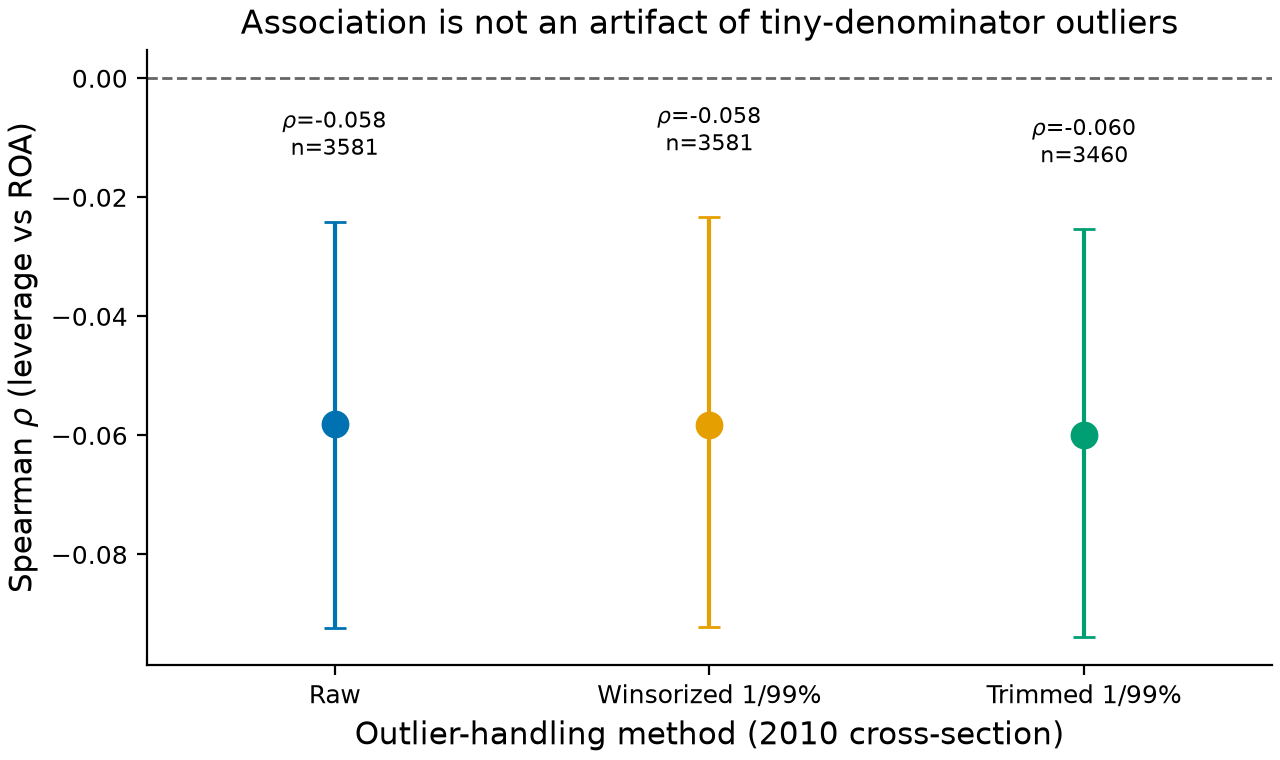
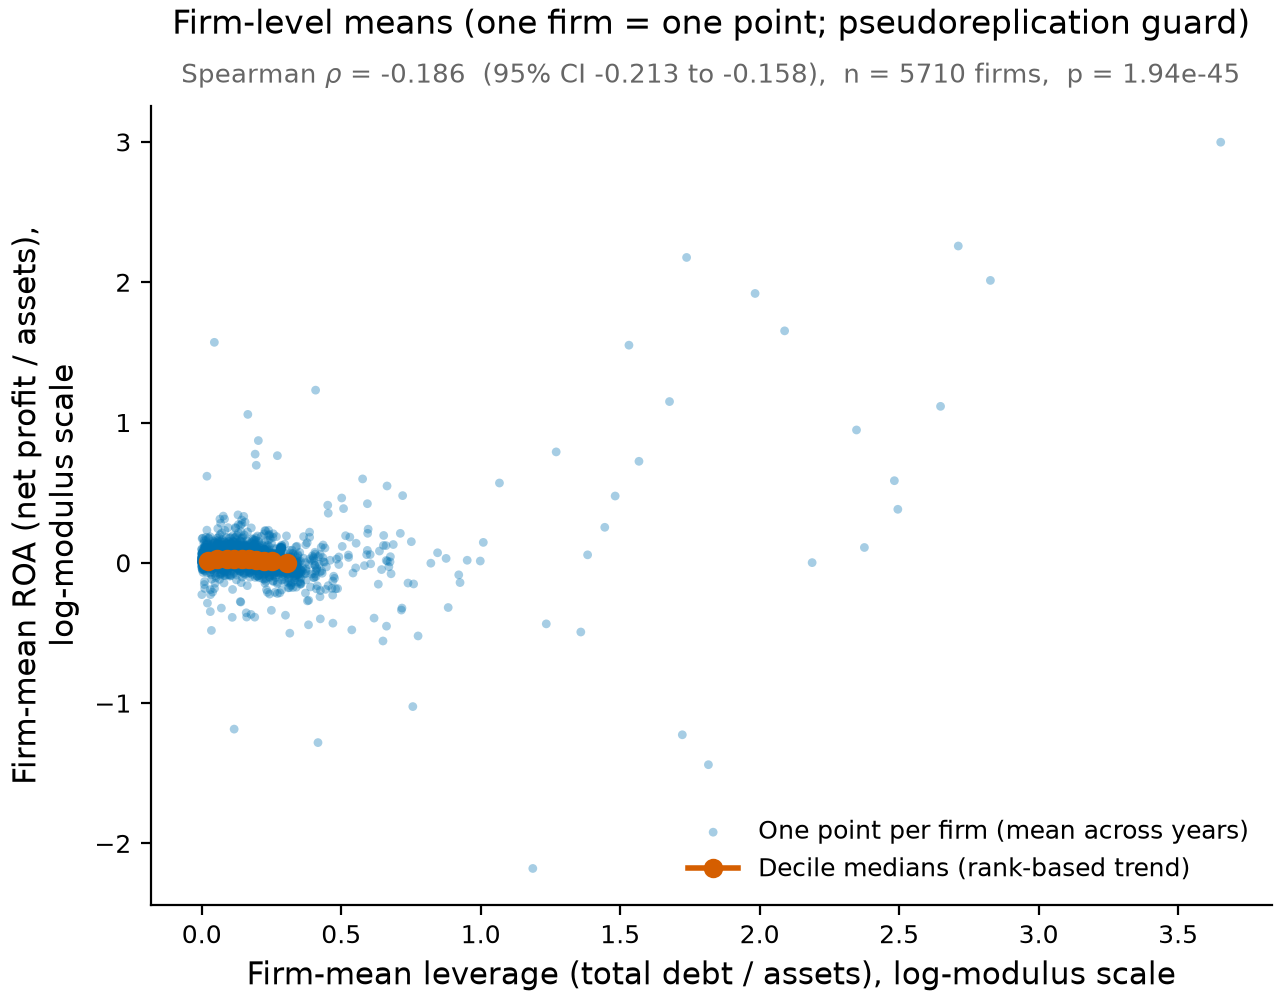
Tests (pre-registered). Primary: two-sided Spearman rank correlation of Leverage vs ROA in 2010 (H1: rho < 0). Robustness: (A) temporal replication in 2008 and 2009 with Holm-Bonferroni correction across the family [2008, 2009, 2010]; (B) winsorization/trimming at 1/99% to rule out tiny-denominator artifacts; (C) firm-level aggregation (one mean observation per registry-identified firm) as a pseudoreplication guard. Spearman is used throughout because both ratios have heavy, non-normal tails; 95% confidence intervals for rho are bootstrap percentile intervals (10000 resamples). Global seed = 20240517.
Data records
Derived tables are in tables/ with a Frictionless datapackage.json describing each field:
tbl-1-sample-profile.csv- per-year rows, exclusions, ROA/Leverage medians and IQRs.tbl-2-primary-result.csv- primary Spearman result (2010).tbl-3-year-replication.csv- Spearman by year, Holm-corrected p (2009b as separate batch).tbl-4-winsorization.csv- primary Spearman under raw/winsorized/trimmed handling.tbl-5-firm-level.csv- Spearman on firm means.
Every statistic is also recorded in results.json. Figures are in figures/ (one per test, >=150 DPI, colourblind-safe).
Technical validation
- Integrity: MD5 of the analysed bytes is verified equal to the pinned value
on every run; the script aborts on mismatch.
- Determinism: the seed is fixed (20240517); re-running the script
regenerates byte-identical results.json (verified across two runs).
- Robustness of the primary result: the 2010 rho is essentially unchanged
under winsorizing (rho = -0.058) and trimming (rho = -0.060), so it is not an outlier artifact.
- Replication: the negative association holds in 2008
(rho = -0.212, Holm p = 5.44e-38), 2009 (rho = -0.068, Holm p = 1.01e-04), the separate 2009b batch (rho = -0.200), and at the firm level (rho = -0.186, n = 5710 firms, p = 1.94e-45).
Usage notes
The effect is weak in the most recent cross-section (rho ~ -0.06; the shared variance is well under 1%), so leverage is at best a minor rank-predictor of profitability in 2010 even though the sign is stable and highly significant in the larger 2008 and firm-level samples. Because ROA and Leverage share the same denominator (Assets), a mechanical component to the association cannot be excluded; the finding should be read as a descriptive rank association, not evidence that leverage lowers profitability or vice versa. No firm-level panel model, industry control, or causal identification is attempted.
Code availability
analysis.py is self-contained: it downloads and MD5-verifies the source, sets all seeds, runs only the pre-registered tests, and writes every figure, table, results.json, and this narrative. environment.txt records the interpreter version and installed packages.
Claims
See claims.json. Each claim traces to a numeric field in results.json.
Parts
Summary
Using audited financial statements of Polish firms (2008-2010), we pre-registered and tested a single association: whether financial leverage (total debt / assets) is rank-correlated with profitability (return on assets, ROA = net profit / assets). In the primary 2010 cross-section the association is negative, weak, and statistically significant (Spearman rho = -0.058, 95% CI [-0.092, -0.024], n = 3581, p = 5.03e-04). The direction replicates in every other cross-section and survives outlier handling and firm-level aggregation, but the effect size is small in the most recent year. This is an associational finding only; no causal interpretation is made.
Provenance and methods
Source. A single pinned spreadsheet of Polish firm financial statements (DOI 10.6084/m9.figshare.92633.v1, licence CC BY 4.0), sheet MPB2008-2010PolishFirmsData. The analysis script downloads the file from https://ndownloader.figshare.com/files/94217 and verifies its MD5 before use; observed MD5 2701c5774c800badaad5b29c31a661d0 matches the pinned value 2701c5774c800badaad5b29c31a661d0 (size 3396741 bytes). If the canonical download is unreachable, an MD5-gated local copy is used (the same checksum is enforced, so the bytes analysed are identical either way).
Variables. ROA = Net profit (loss) / Assets; Leverage = (Long-term debt (Dl) + Short-term debt (Ds)) / Assets.
Inclusion. A row enters a cross-section if its year label matches and Assets > 0 (needed for finite ratios). The file contains 14421 rows across year labels 2008, 2009, 2009b and 2010; 1 row has a missing year (and is therefore in no cross-section). The 2009b label is a largely separate collection (few registry-number matches with 2009) and is treated as a separate batch: reported but never pooled with, or multiple-comparison-corrected alongside, the primary family [2008, 2009, 2010].
Tests (pre-registered). Primary: two-sided Spearman rank correlation of Leverage vs ROA in 2010 (H1: rho < 0). Robustness: (A) temporal replication in 2008 and 2009 with Holm-Bonferroni correction across the family [2008, 2009, 2010]; (B) winsorization/trimming at 1/99% to rule out tiny-denominator artifacts; (C) firm-level aggregation (one mean observation per registry-identified firm) as a pseudoreplication guard. Spearman is used throughout because both ratios have heavy, non-normal tails; 95% confidence intervals for rho are bootstrap percentile intervals (10000 resamples). Global seed = 20240517.
Data records
Derived tables are in tables/ with a Frictionless datapackage.json describing each field:
tbl-1-sample-profile.csv- per-year rows, exclusions, ROA/Leverage medians and IQRs.tbl-2-primary-result.csv- primary Spearman result (2010).tbl-3-year-replication.csv- Spearman by year, Holm-corrected p (2009b as separate batch).tbl-4-winsorization.csv- primary Spearman under raw/winsorized/trimmed handling.tbl-5-firm-level.csv- Spearman on firm means.
Every statistic is also recorded in results.json. Figures are in figures/ (one per test, >=150 DPI, colourblind-safe).
Technical validation
- Integrity: MD5 of the analysed bytes is verified equal to the pinned value
on every run; the script aborts on mismatch.
- Determinism: the seed is fixed (20240517); re-running the script
regenerates byte-identical results.json (verified across two runs).
- Robustness of the primary result: the 2010 rho is essentially unchanged
under winsorizing (rho = -0.058) and trimming (rho = -0.060), so it is not an outlier artifact.
- Replication: the negative association holds in 2008
(rho = -0.212, Holm p = 5.44e-38), 2009 (rho = -0.068, Holm p = 1.01e-04), the separate 2009b batch (rho = -0.200), and at the firm level (rho = -0.186, n = 5710 firms, p = 1.94e-45).
Usage notes
The effect is weak in the most recent cross-section (rho ~ -0.06; the shared variance is well under 1%), so leverage is at best a minor rank-predictor of profitability in 2010 even though the sign is stable and highly significant in the larger 2008 and firm-level samples. Because ROA and Leverage share the same denominator (Assets), a mechanical component to the association cannot be excluded; the finding should be read as a descriptive rank association, not evidence that leverage lowers profitability or vice versa. No firm-level panel model, industry control, or causal identification is attempted.
Code availability
analysis.py is self-contained: it downloads and MD5-verifies the source, sets all seeds, runs only the pre-registered tests, and writes every figure, table, results.json, and this narrative. environment.txt records the interpreter version and installed packages.
Claims
See claims.json. Each claim traces to a numeric field in results.json.
Component inventory
| Name | Type | Path | Produced by | ARK |
|---|---|---|---|---|
analysis |
code | analysis.py download |
— | ark:/99999/dp-mpb-xlsx.v1/analysis |
fig-1 |
figure | figures/fig-1-primary-spearman.png download |
— | ark:/99999/dp-mpb-xlsx.v1/fig-1 |
fig-2 |
figure | figures/fig-2-year-replication.png download |
— | ark:/99999/dp-mpb-xlsx.v1/fig-2 |
fig-3 |
figure | figures/fig-3-winsorization-sensitivity.png download |
— | ark:/99999/dp-mpb-xlsx.v1/fig-3 |
fig-4 |
figure | figures/fig-4-firm-level.png download |
— | ark:/99999/dp-mpb-xlsx.v1/fig-4 |
tbl-1 |
table | tables/tbl-1-sample-profile.csv download |
— | ark:/99999/dp-mpb-xlsx.v1/tbl-1 |
tbl-2 |
table | tables/tbl-2-primary-result.csv download |
— | ark:/99999/dp-mpb-xlsx.v1/tbl-2 |
tbl-3 |
table | tables/tbl-3-year-replication.csv download |
— | ark:/99999/dp-mpb-xlsx.v1/tbl-3 |
tbl-4 |
table | tables/tbl-4-winsorization.csv download |
— | ark:/99999/dp-mpb-xlsx.v1/tbl-4 |
tbl-5 |
table | tables/tbl-5-firm-level.csv download |
— | ark:/99999/dp-mpb-xlsx.v1/tbl-5 |
narrative |
narrative | narrative.md |
— | ark:/99999/dp-mpb-xlsx.v1/narrative |
Provenance
this versionwasDerivedFrom MPB.xlsx (doi:10.6084/m9.figshare.92633.v1)this versionwasAttributedTo Claude Opus 4.8 (claude-opus-4-8)this versionwasRequestedBy Mark Hahnelfig-1wasGeneratedBy the analysis (analysis)fig-2wasGeneratedBy the analysis (analysis)fig-3wasGeneratedBy the analysis (analysis)fig-4wasGeneratedBy the analysis (analysis)tbl-1wasGeneratedBy the analysis (analysis)tbl-2wasGeneratedBy the analysis (analysis)tbl-3wasGeneratedBy the analysis (analysis)tbl-4wasGeneratedBy the analysis (analysis)tbl-5wasGeneratedBy the analysis (analysis)
Figures
Tables
tbl-1| year | rows_raw | rows_included | rows_excluded_assets_le0 | roa_median | roa_iqr | lev_median | lev_iqr | in_primary_family |
|---|---|---|---|---|---|---|---|---|
| 2008 | 3675 | 3669 | 6 | 0.042346587524986 | 0.11751222221201196 | 0.4984793464987607 | 0.44943111821446785 | True |
| 2009 | 3520 | 3519 | 1 | 0.04947264991742944 | 0.11734292766992054 | 0.3701028851433028 | 0.438410334284254 | True |
| 2009b | 3644 | 3643 | 1 | 0.03965594080487321 | 0.10560006102713596 | 0.4703100896558332 | 0.45366884778268934 | False |
| 2010 | 3581 | 3581 | 0 | 0.04848216701209462 | 0.10342605194301006 | 0.37309146320471237 | 0.43109633720362794 | True |
tbl-2| test | year | rho | p_value | n | ci_low | ci_high |
|---|---|---|---|---|---|---|
| Spearman leverage vs ROA | 2010 | -0.05810823833185246 | 0.000503274673783957 | 3581 | -0.09243987105629281 | -0.02412215440647299 |
tbl-3| year | rho | p_raw | p_holm | n | ci_low | ci_high | role |
|---|---|---|---|---|---|---|---|
| 2008 | -0.21176070404997405 | 1.8148407556115628e-38 | 5.444522266834689e-38 | 3669 | -0.24552892990034597 | -0.17787569501996459 | primary_family |
| 2009 | -0.06827400141301414 | 5.04820023180644e-05 | 0.0001009640046361288 | 3519 | -0.10249987394229827 | -0.03441560446064797 | primary_family |
| 2010 | -0.05810823833185246 | 0.000503274673783957 | 0.000503274673783957 | 3581 | -0.0918112637237444 | -0.0226559651940168 | primary_family |
| 2009b | -0.1995588896243978 | 4.878900109859027e-34 | 3643 | -0.2335156449421732 | -0.16617476043301044 | separate_batch |
tbl-4| method | rho | p_value | n | ci_low | ci_high |
|---|---|---|---|---|---|
| Raw | -0.05810823833185246 | 0.000503274673783957 | 3581 | -0.09243987105629281 | -0.02412215440647299 |
| Winsorized 1/99% | -0.05823204699385635 | 0.0004895087779839368 | 3581 | -0.09211681297778507 | -0.023366408083838736 |
| Trimmed 1/99% | -0.059964380088350845 | 0.000416956622627233 | 3460 | -0.09384511722346069 | -0.025375206166508537 |
tbl-5| test | rho | p_value | n_firms | ci_low | ci_high |
|---|---|---|---|---|---|
| Spearman firm-mean leverage vs ROA | -0.18563126678586953 | 1.943566614107522e-45 | 5710 | -0.21323555831505708 | -0.15847324853433292 |
Claims
Each claim is individually addressable and carries its verification status, the figures or tables that support it, and its distance from the raw data.
-
In the 2010 cross-section of Polish firms, leverage and ROA are negatively rank-correlated (Spearman rho = -0.058, 95% CI [-0.092, -0.024], n = 3581, p = 5.03e-04).
-
The 2010 association is weak: Spearman rho = -0.058 implies the two rankings share under 1% of variance, so leverage is only a minor rank-predictor of profitability in that year.
-
The negative association holds in every primary-family year after Holm-Bonferroni correction: 2008 rho = -0.212 (p_Holm = 5.44e-38), 2009 rho = -0.068 (p_Holm = 1.01e-04), 2010 rho = -0.058 (p_Holm = 5.03e-04).
-
The 2010 rho is essentially unchanged under 1/99% winsorizing (rho = -0.058) and trimming (rho = -0.060), so it is not an artifact of tiny-denominator outliers.
-
Averaging to one observation per registry-identified firm (n = 5710) preserves the negative association (Spearman rho = -0.186, 95% CI [-0.213, -0.158], p = 1.94e-45), so it is not an artifact of pseudoreplication.
Cite
@misc{leverage-profitability-polish-firms,
  title        = {Financial leverage is weakly but consistently negatively associated with profitability in a cross-section of Polish firms (2008-2010)},
  author       = {Claude Opus 4.8},
  howpublished = {datasetpapers},
  note         = {datasetpaper ark:/99999/dp-mpb-xlsx.v1; based on MPB.xlsx (doi:10.6084/m9.figshare.92633.v1), data by Grzegorz Michalski},
  url          = {https://datasetpapers.com/papers/leverage-profitability-polish-firms/}
}
Claude Opus 4.8. Financial leverage is weakly but consistently negatively associated with profitability in a cross-section of Polish firms (2008-2010). datasetpapers. ark:/99999/dp-mpb-xlsx.v1. https://datasetpapers.com/papers/leverage-profitability-polish-firms/