
The Outlier Table
Of the 15 tables inside Dr. Duke's Phytochemical and Ethnobotanical Databases, one refuses to look like the rest. CHEM_MEANS — six columns recording chemical concentration statistics — is 83.3% Double-type (5 of its 6 columns) and exactly 0% Short Text. It is the only table in the entire schema with zero text columns, and it produces the single largest standardized residual anywhere in the 15-table-by-4-type breakdown: +3.68, more than three and a half standard deviations above what independence between table and type would predict.
The schema CHEM_MEANS lives in belongs to a database that started as one botanist's card catalog. James A. Duke spent 27 years as an economic botanist at the USDA's Agricultural Research Service in Beltsville, Maryland, compiling the plant, chemical, and ethnobotanical data that became his 1992 reference work, the Handbook of Phytochemical Constituents of GRAS Herbs and Other Economic Plants. After his 1995 retirement, that compilation went online as Dr. Duke's Phytochemical and Ethnobotanical Databases, now maintained by the USDA National Agricultural Library under a CC0 public-domain license.
Against that backdrop, CHEM_MEANS' extremity is easier to feel: across all 199 declared columns in the schema, Short Text is the dominant type by far — 138 columns, 69.3% of everything — with Double a distinct minority at 37 columns (18.6%). A table with zero Short Text columns is not just unusual, it is the single most lopsided table in a schema that otherwise leans overwhelmingly toward text.
What follows is not an analysis of the plants, chemicals, or remedies this database actually contains — it's an analysis of its data dictionary, the blueprint describing what type of value each of its 199 columns is allowed to hold. That distinction matters: this is a story about documentation design, not botany.
A Government Database With a Cult Following
Duke earned his doctorate in botany from the University of North Carolina in 1961, then spent time with the Missouri Botanical Garden and the Battelle Memorial Institute doing ecological fieldwork in Panama and Colombia before joining USDA in 1963, eventually rising to chief of both the Plant Taxonomy Laboratory and USDA's Economic Botany Laboratory.
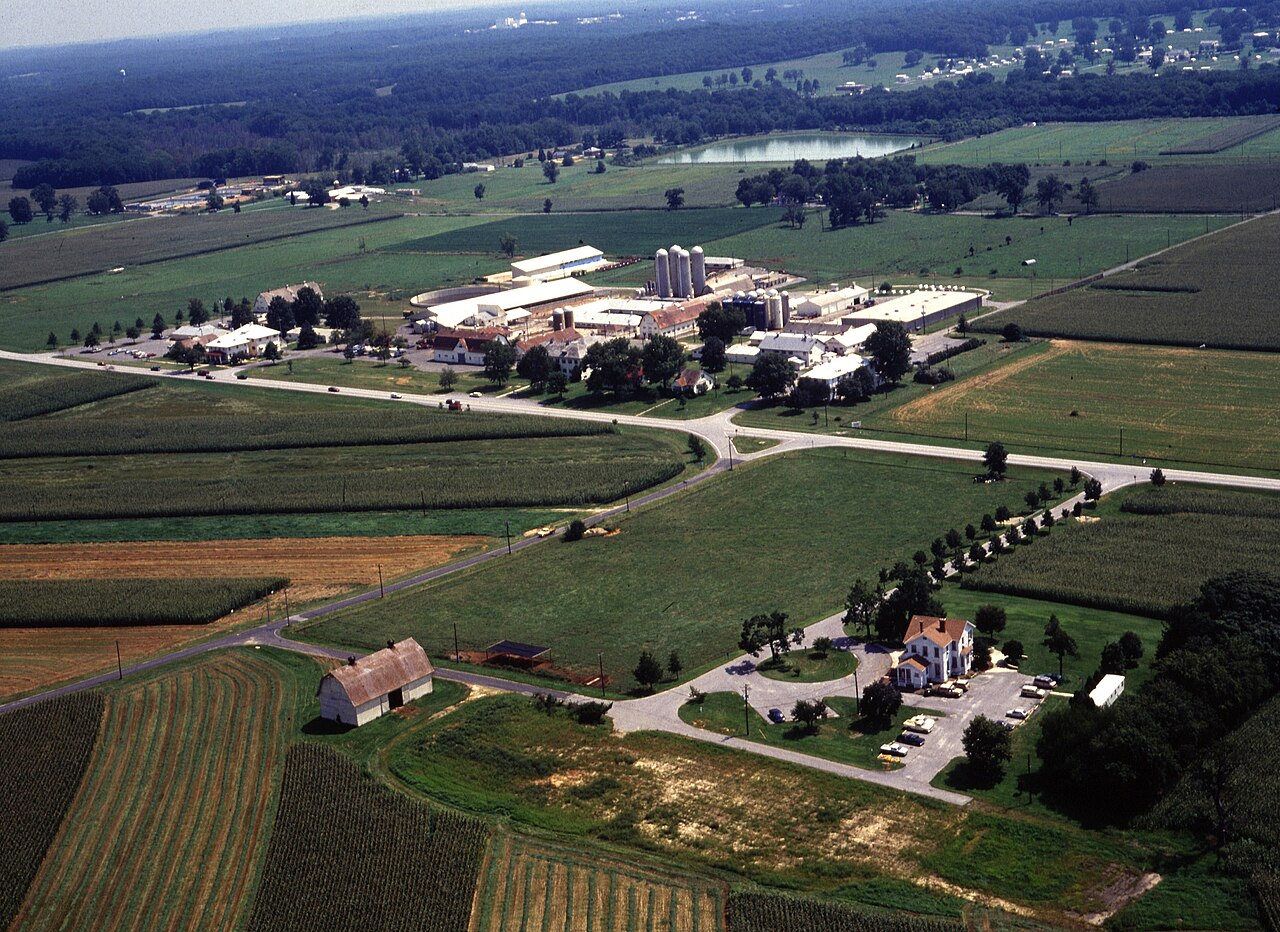
The database he left behind is not a museum piece. USDA itself describes it as "one of the world's leading repositories of ethnobotanical data," still informing pharmaceutical, nutritional, and biomedical research into conditions like cancer and AIDS — a 2020 peer-reviewed paper used it as a validation reference for ethnoveterinary medicinal plants documented in a British Columbia pet-owner survey. Duke also had a second life as a popular author: his 1997 book The Green Pharmacy was a national bestseller, which is part of why the same search tool researchers use also gets steady traffic from gardeners and herbalists.
The data dictionary examined here — the schema, not the data — parses into 199 field rows spread across 15 tables, describing 280,858 records in total. Every one of those 199 columns has a non-null definition and a non-null "attributes" note; only the "format" field is sparsely populated, blank for 153 of 199 columns (76.9%).
Two tables dominate by sheer record count: FARMACY_NEW (104,388 records) and ETHNOBOT (82,873 records) together hold two-thirds of everything the database describes. Both are naming and free-text tables — remedy descriptions and ethnobotanical-use records — not measurement tables. Scale and numeric-ness, it turns out, are not the same axis; more on that later.
Testing the Obvious
Re-running the schema's core test independently — the same Monte-Carlo permutation procedure, same seed, same 20,000 replicates — reproduces the published result to four decimal places: chi-square = 62.47 (42 degrees of freedom), Monte-Carlo p = 0.0325, Cramer's V = 0.323 (bias-corrected V = 0.186), across all 199 columns. The 15-by-4 table of tables-by-types is sparse — 52 of its 60 cells (86.7%) have an expected count under 5 — which is exactly why a Monte-Carlo p-value stands in for the standard chi-square reference distribution here rather than replacing it out of caution.
That substitution deserves a beat of explanation, because the 15 tables analyzed are not a sample of some larger population of possible schemas — they are the entire schema. A Monte-Carlo permutation test sidesteps that by asking a narrower, cleaner question: if the 199 type-labels observed were reshuffled at random among the 15 tables, how often would an arrangement this lopsided arise by chance alone? That reframing is precisely the right tool when, as here, most cells in the table are too small for the classical approximation to be trusted.
How impressed should a reader be by a Cramer's V of 0.32? On the commonly cited rule of thumb, V near 0.1 counts as a small association, near 0.3 as medium, and near 0.5 as large. The raw V of 0.323 sits right at the "medium" line; the bias-corrected version — which discounts the inflation that small, sparse tables mechanically produce — comes in lower, at 0.186, closer to "small-to-medium." Neither reading supports a dramatic headline. Both support a real one.
The Correction That Almost Wins, and the One That Does
The primary test was never run alone — it was pre-registered alongside two robustness checks, and all three p-values were corrected together with the Holm-Bonferroni method, because testing three related hypotheses on the same data and reporting only the one that "worked" is exactly the kind of statistical shortcut that makes a finding un-trustworthy. After correction, the primary test's p-value of 0.0325 becomes 0.0650 — it does not clear the conventional 0.05 bar. Of the three pre-registered tests, exactly one survives Holm correction at alpha = 0.05.
That survivor is the robustness check that removes the one Long Integer ID column present in every single table. With that constant, structural key stripped out (184 columns remain), the same Monte-Carlo procedure produces chi-square = 52.48, corrected p around 0.033–0.036, and a Cramer's V of 0.378 — up from 0.323 in the full test. That is the opposite of what a confound looks like: if the shared ID column were manufacturing the association, removing it should weaken the signal. Instead the effect size grows by roughly 40%. The constant key was diluting the pattern, not producing it.
The other robustness check — collapsing all four types down to the simplest possible split, Text versus everything else — still finds a moderate association (chi-square = 23.60, Cramer's V = 0.344) even at that coarsest resolution. But like the primary test, its corrected p-value also lands at the 0.065 boundary, not clearing significance on its own.
So the honest scorecard is one test out of three, not three out of three — and it's the one where a shared bookkeeping column was removed from the count, not the headline test with all 199 columns intact. That is a meaningfully weaker claim than "the schema is significantly patterned," and a meaningfully stronger one than "there's nothing here."
Where the Pattern Actually Lives
Statistically, this is not a schema-wide gradient — it's a handful of unusual tables. Besides CHEM_MEANS (+3.68 standardized residual on Double), YIELDS shows the second-largest excess of Double columns (+2.66); at the other extreme, SUPERACT shows an excess of Long Integer columns (+1.63, in a table of just 3 columns) and PARTS shows an excess of Date-With-Time columns (+1.40). A handful of cells out of 60 carry most of the chi-square statistic.
There is a mundane, decades-old explanation for that split, borrowed from ordinary relational-database design: schemas conventionally separate "reference" tables — descriptive, mostly text, holding names and categories — from "measurement" tables, which hold numeric quantities tied to those entities. CHEM_MEANS and YIELDS are quantity tables, tracking chemical concentration statistics and yield measurements. ETHNOBOT, FARMACY_NEW, and FNFTAX are naming and classification tables, tracking plant taxonomy and folk-remedy descriptions. Different jobs, different type mixes — a design choice, not a mystery.
Ranking all 15 tables by their share of Double columns makes the split concrete: CHEM_MEANS (83.3% Double) and YIELDS (33.9%) sit at the numeric end, alongside ASSAY and CODES (33.3% each). Five tables — ACTIVITIES, DOSAGE, PARTS, REFERENCES, and SUPERACT — have exactly 0% Double columns. Notably, the database's two biggest tables by record count, FARMACY_NEW (104,388 records) and ETHNOBOT (82,873 records), both sit at the text-heavy end (7.7% and 5.0% Double respectively) — the largest tables in the database are not the most numeric ones. Scale and "numeric-ness" turn out to be independent design dimensions.
The Column That Can't Make Up Its Mind
Twenty column names are reused across more than one table in this schema — a normal fingerprint of shared keys and audit columns. ID appears in all 15 tables (always the Long Integer primary key); USERID, MODIFIED, and CREATED each appear in 9 tables; REFERENCE appears in 7. Of those 20 reused names, 19 are declared with the exact same type everywhere they show up.
One is not. PLCO — a plant-lookup code shared across CODES, FARMACY_NEW, FNFTAX, and YIELDS — is declared Double in CODES and YIELDS, but Short Text in FARMACY_NEW and FNFTAX. This is not a statistical inference; it's a fact a database administrator could check by eye and fix in five minutes. But it's also the single most concrete, human-legible piece of evidence in this entire analysis that the schema has genuine internal inconsistency — more convincing, in its own small way, than any p-value above, because it needs no correction for multiple comparisons to be true. A query joining across these four tables on PLCO would, in two of them, be joining a number to a piece of text.
It fits a broader pattern: three of the dictionary's five descriptive fields turn out to be redundant with "type." Alongside the already-known degeneracies — "required" is False for every column, "size" is fixed per type — "format" is populated only for Double columns (always "General Number") and Date With Time columns (always "m/d/yyyy"), and blank for every Long Integer and Short Text column. Type isn't just one field among several in this dictionary; it's the one field almost everything else in the dictionary is downstream of.
What the Schema Is Actually Telling Us
Worth restating plainly: the file this whole analysis rests on is named "prelim" — preliminary. It documents the schema as its maintainers wrote it down at one point in time, not a live introspection of the running database and not the phytochemical data itself. Every number here describes documentation design, 199 column definitions, not 280,858 chemical or ethnobotanical records.
Even the schema's own basic geometry resists a simple story: across the 15 tables, how many columns a table has and how many records it holds correlate only weakly (Spearman rho = 0.361). FARMACY_NEW is merely the second-widest table by column count but by far the deepest by record count; YIELDS is the widest table of all but a middling one by record count. Width and depth are separate design choices here, the same way "numeric" and "large" turned out to be separate a section ago.
None of this changes what the database is used for — pharmaceutical and biomedical researchers, veterinary-medicine validators, herbalists, and gardeners still query the same phytochem.nal.usda.gov search tool built on top of this schema, decades after Duke first compiled it by hand. Fittingly, the analysis that produced these numbers ships its own output tables as a Frictionless data package — a small, self-consistent gesture toward the same idea the whole piece has been circling: a resource this widely used deserves its plumbing checked with the same care as its content. The chi-square test says the plumbing is only modestly patterned. The PLCO column says: go check it yourself.