
Datasetpaper · information science / systematic review methodology
Screening decisions and publication year in a systematic-review corpus on business data sharing through data marketplaces
Data story Read the interactive, evidence-linked version of this paper →Paper is a compiled reading view, rendered from the underlying research object (an RO-Crate) — not hand-edited. Object shows that same object taken apart: its individually addressable components, their provenance, and the machine-readable exports agents can fetch directly. Switch above.
- Version
ark:/99999/dp-research-data-business-data-sharing-through-data-marketplace.v1- Concept
ark:/99999/dp-research-data-business-data-sharing-through-data-marketplace
Summary
This analysis profiles the screening/coding table of a systematic literature review on business data sharing through data marketplaces and asks one pre-registered question: within the screened corpus, is a record's publication year associated with its screening decision (Include vs Exclude), and how are exclusion reasons distributed?
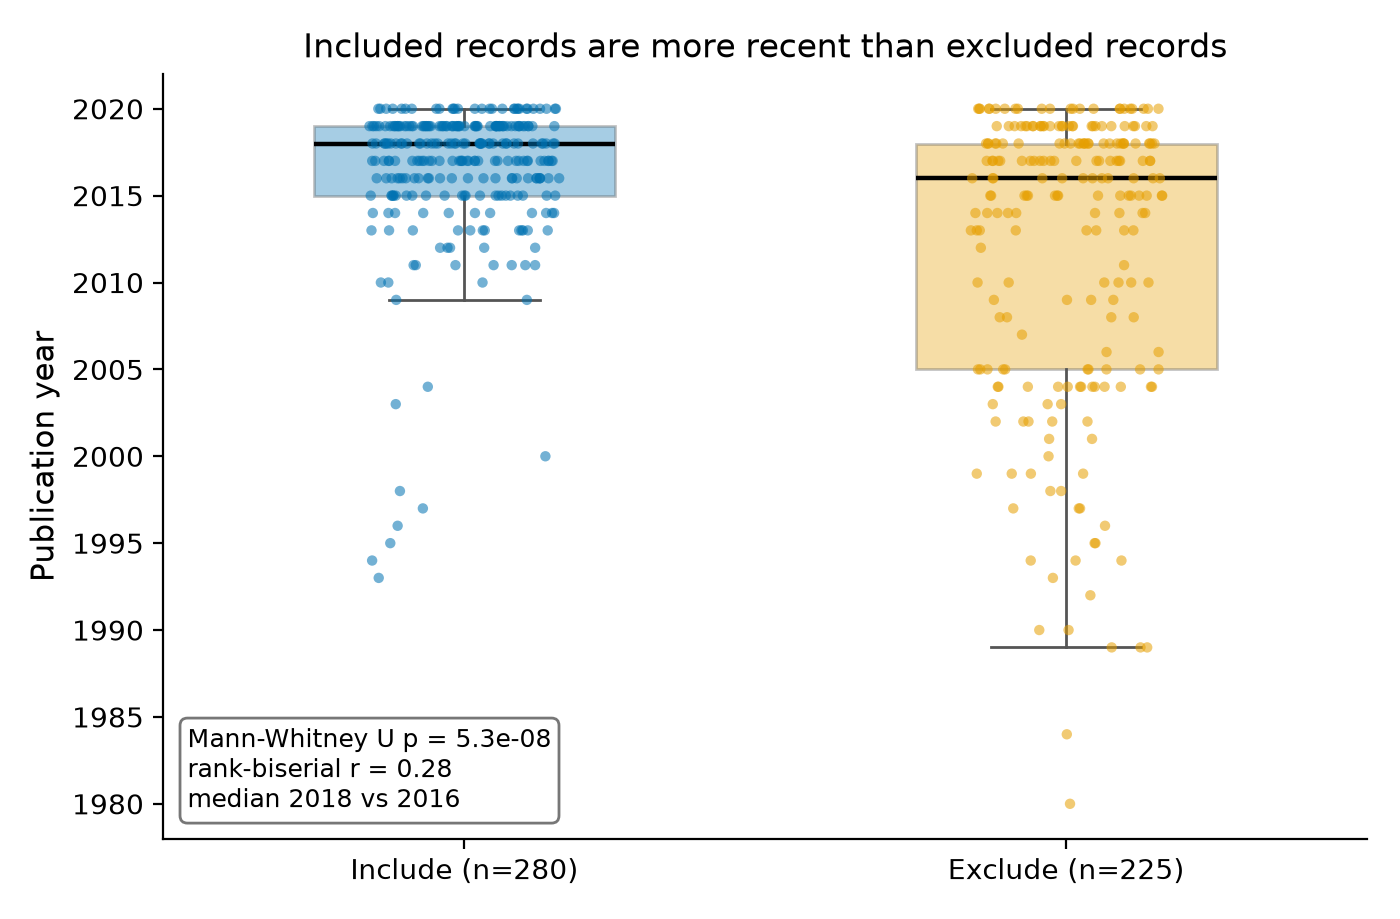
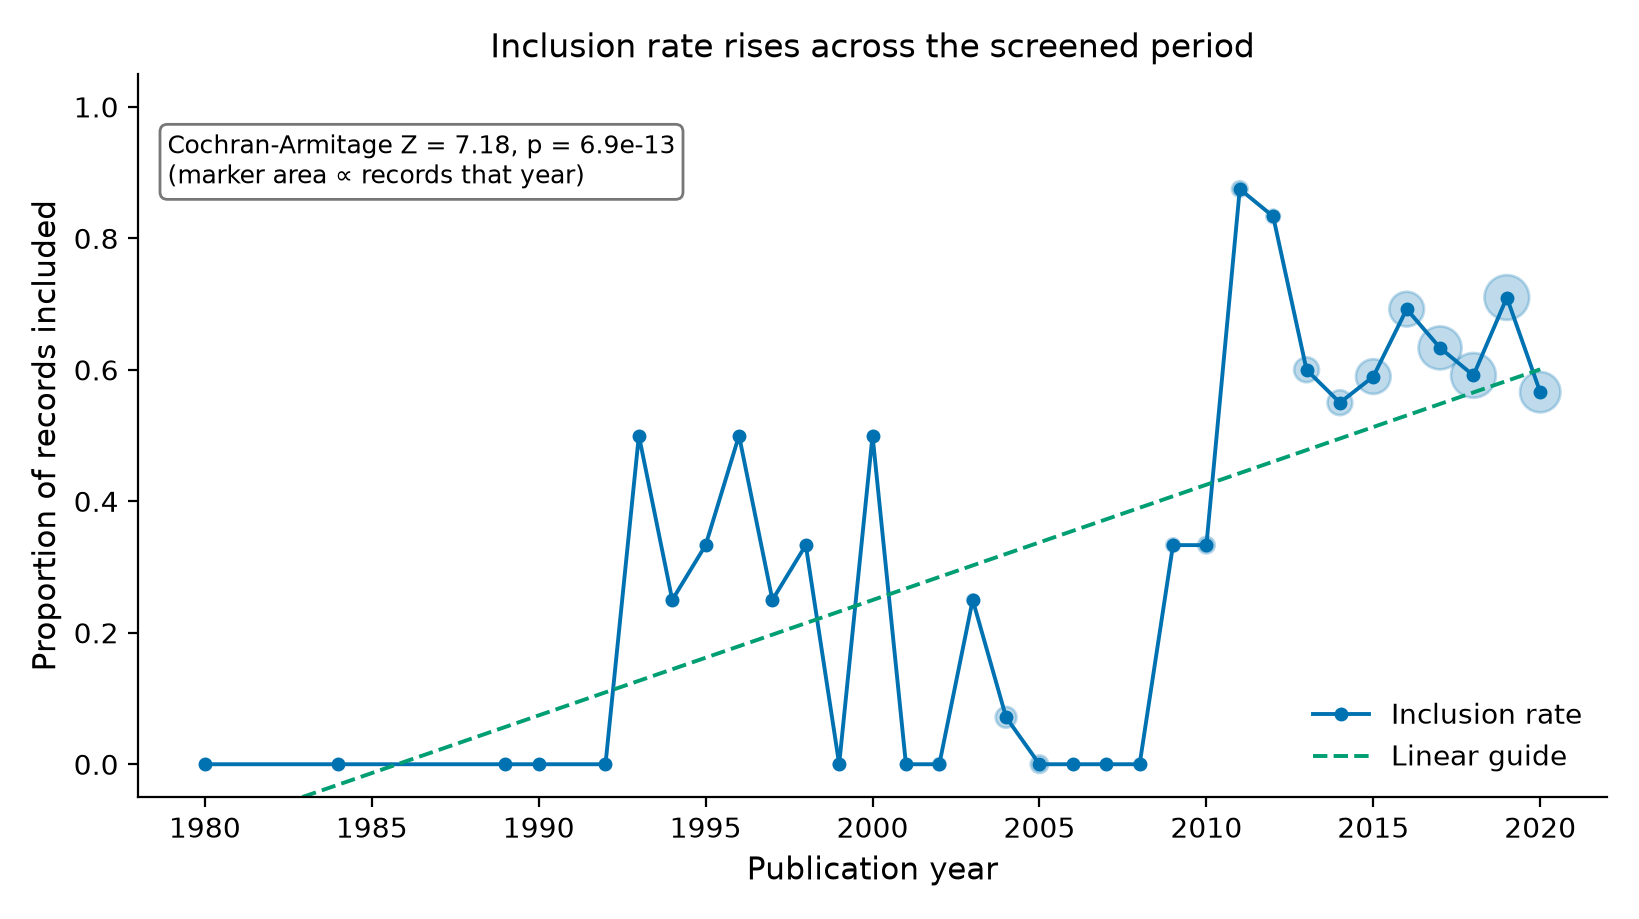
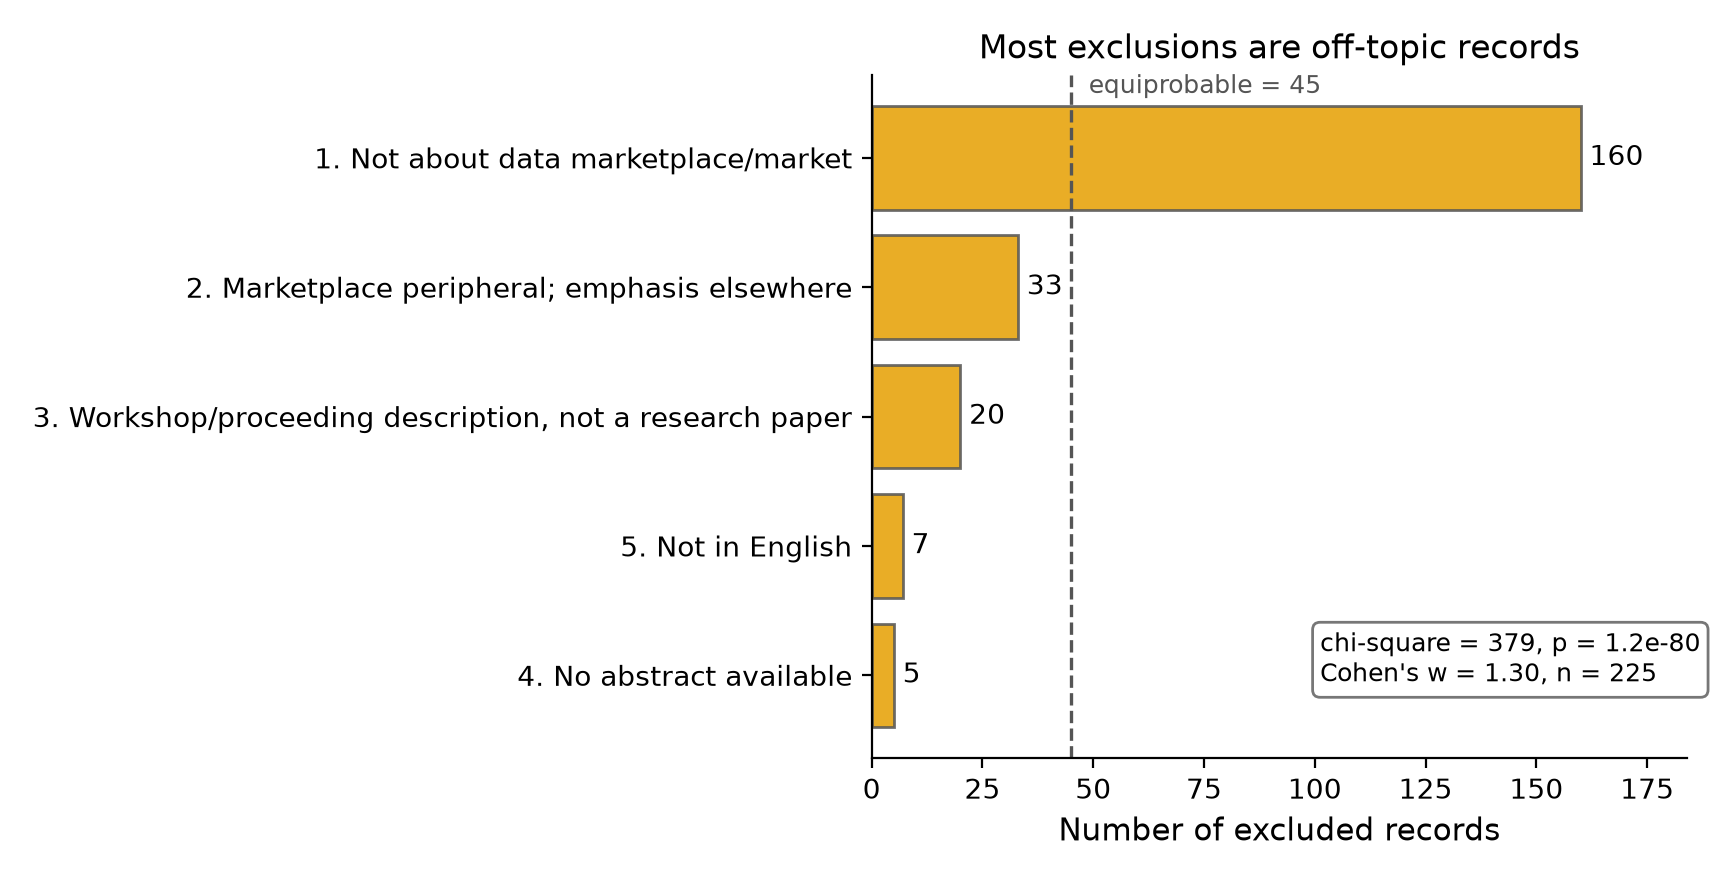
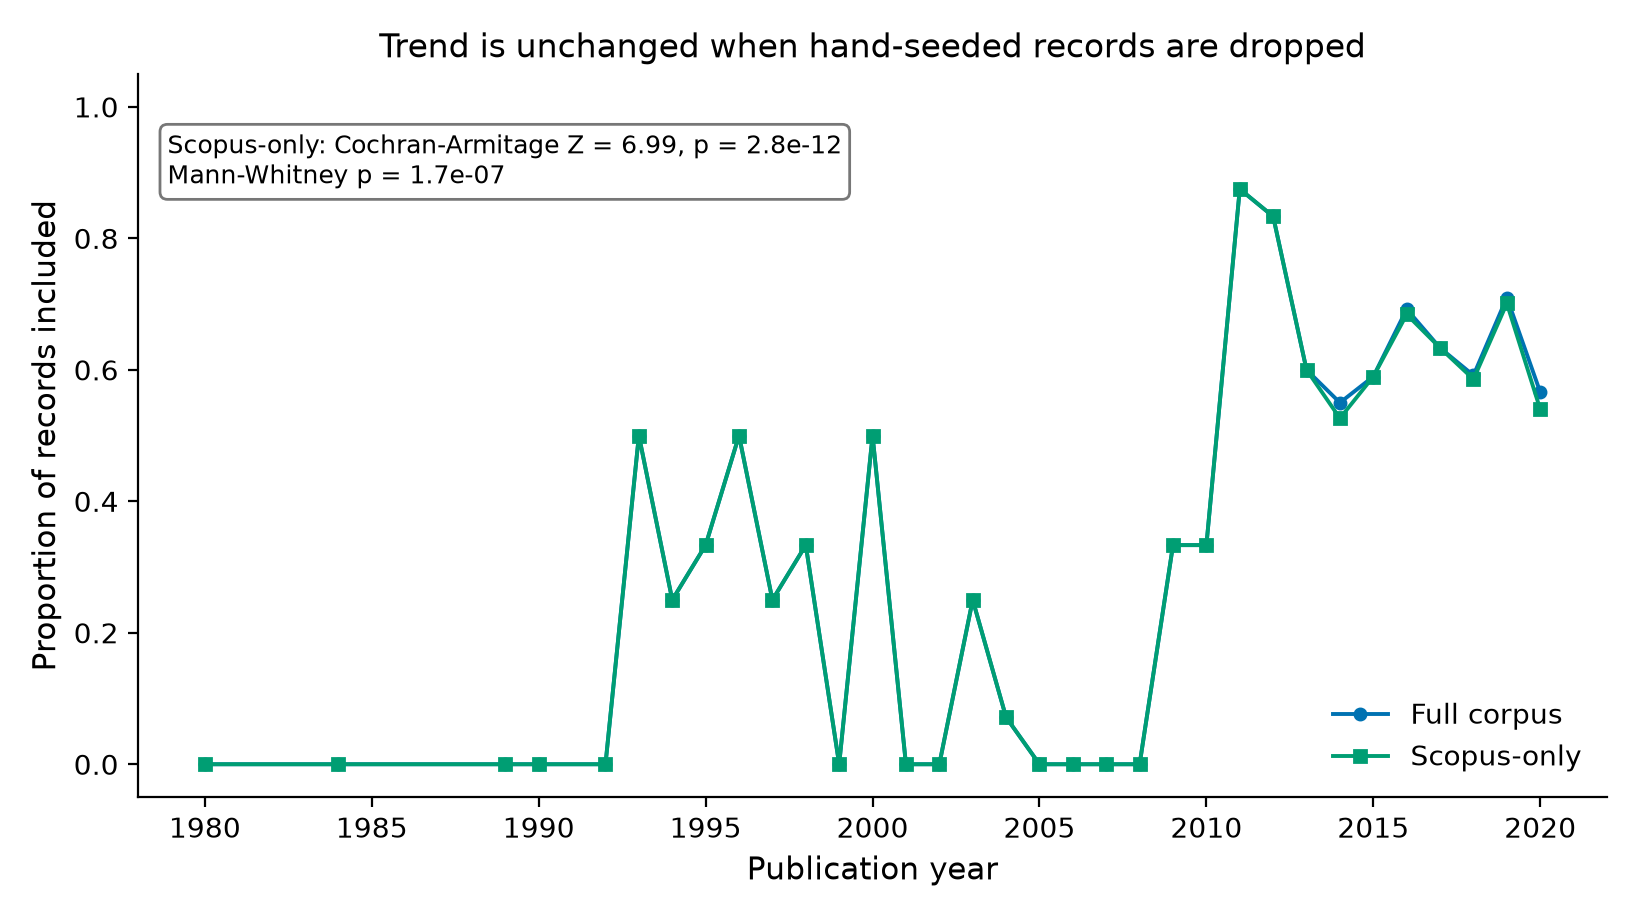
The corpus holds 505 screened records (280 Include, 225 Exclude) spanning 1980–2020. Three pre-registered tests were run with a family-wise Holm correction. (1) Included records are significantly more recent than excluded records (Mann–Whitney U = 40305.5, p = 5.28×10⁻⁸, Holm-corrected p = 5.28×10⁻⁸; rank-biserial r = 0.28; median year 2018 vs 2016). (2) The inclusion proportion rises across ordered publication years (Cochran–Armitage Z = 7.18, p = 6.90×10⁻¹³, Holm-corrected p = 1.38×10⁻¹²; Spearman ρ = 0.24). (3) The five exclusion-reason groups are far from equiprobable (χ²(4) = 378.6, p = 1.16×10⁻⁸⁰, Holm-corrected p = 3.47×10⁻⁸⁰; Cohen's w = 1.30), dominated by off-topic records (160/225 = 71.1%). Both robustness analyses — dropping the 9 hand-seeded core Includes (Scopus-only) and re-binning years into 5-year windows — preserve the trend (Scopus-only Cochran–Armitage Z = 6.99, p = 2.76×10⁻¹²; 5-year-bin Z = 7.28, p = 3.32×10⁻¹³). All three primary effects are large and survive correction. These are descriptive associations within one review's screening record; no causal interpretation is made.
Provenance and methods
Source data. Research Data — Business Data Sharing through Data Marketplaces, DOI [10.4121/14673813.v2](https://doi.org/10.4121/14673813.v2), licensed CC BY 4.0. A single workbook (Research_Data_Business_Data_Sharing_vJTAER.xlsx, 814,076 bytes, md5 27495339d87f52d4f3036a9927c94b7e) was used. The reproducible script first attempts the canonical download and md5-verifies it; failing that, it falls back to an md5-gated local copy and hard-fails on any mismatch, so the md5 is the sole authority for data identity.
Analysed sheet. 1. Identified articles — the screening/coding table, with columns: Article reference number, Source, Year, Authors, Title, Abstract, Author Keywords, Index Keywords, Included or excluded?, Reason of exclusion, Reason of exclusion (by group), Reason of exclusion (by group with desc.).
Pre-registered tests (all two-sided, α = 0.05, seed = 42):
- H1 — Mann–Whitney U on publication Year, Include vs Exclude. A
nonparametric test was chosen because Shapiro–Wilk rejected normality in both groups (Include W = 0.671, p = 5.8×10⁻²³; Exclude W = 0.828, p = 4.7×10⁻¹⁵). Effect size is the rank-biserial correlation r = 2·AUC − 1, where AUC = P(Include year > Exclude year).
- H2 — Cochran–Armitage trend test for the inclusion proportion across
ordered publication years; Spearman's ρ between year and the include indicator is reported alongside.
- H3 — χ² goodness-of-fit that the five exclusion-reason groups are not
equiprobable; effect size is Cohen's w.
- Multiple comparisons. A Holm–Bonferroni correction is applied across the
three primary p-values.
Robustness / sensitivity. (R1) H1 and H2 re-run on Scopus-only records, dropping the 9 hand-seeded "core article" records (all Include) that were not drawn by the database query. (R2) The trend test re-run on 5-year publication-year bins.
Missing-value handling. The decision and Year columns are complete (0 nulls); all 505 records enter H1/H2. Exclusion-group codes are present for all 225 excluded records and enter H3; counts reconcile exactly (280 + 225 = 505; exclusion groups sum to 225).
Data records
The derived tables are provided as CSVs with a Frictionless tables/datapackage.json (tabular-data-package profile, per-field types):
tbl-1-decision-year-summary.csv— n, median and IQR of publication year by
decision, plus the Mann–Whitney statistic, p, Holm-corrected p and effect size.
tbl-2-inclusion-rate-by-year.csv— per-year record count, included count and
inclusion rate (33 years, 1980–2020).
tbl-3-exclusion-reason-groups.csv— the five exclusion-reason groups with
counts, percentage of excluded records, and the χ² statistics.
tbl-4-robustness-scopus-only.csv— full-corpus vs Scopus-only vs 5-year-bin
re-analyses.
Every statistic reported here is also serialised in results.json, keyed by test, including test name, statistic, raw p, Holm-corrected p, effect size, n, and the underlying counts.
Technical validation
- Reproducibility.
analysis.pyfixesrandomandnumpyseeds to 42 and
regenerates every figure, table and number on re-run; the run reported here reproduced all primary statistics bit-for-bit across two consecutive executions.
- Data integrity. The workbook md5 is verified before use; a mismatch is a
hard failure.
- Count reconciliation. Decision counts (280 Include + 225 Exclude = 505),
per-year totals, and exclusion-group totals (160 + 33 + 20 + 5 + 7 = 225) all reconcile with the source; assertions in the script enforce this.
- Assumption checks. Shapiro–Wilk justified the nonparametric primary tests.
The Cochran–Armitage trend was corroborated by Spearman's ρ and by two independent robustness analyses, all significant in the same direction.
- Effect sizes. All three primary effects are reported with effect sizes
(rank-biserial r = 0.28; Cohen's w = 1.30) and survive Holm correction; none is a marginal or null result requiring cautious framing, though the rank-biserial effect for the year difference is modest in magnitude.
Usage notes
- These are associations within one review's screening record, not
properties of the data-marketplace literature at large; the corpus is the set of records that a specific search returned and that specific reviewers coded.
- No causal claim is made or supported: the year–inclusion association
reflects that this review's in-scope topic (data marketplaces) is itself a recent research area, so recent records are more often on-topic. Year is not manipulated and nothing here implies that publication year causes inclusion.
- The rising inclusion rate and the concentration of exclusions in the
"off-topic" group are consistent with a broad database query (Scopus) that retrieved many records only lexically related to "data market(place)".
- The 9 hand-seeded core Includes are non-random by construction; the Scopus-only
robustness analysis exists precisely to show they do not drive the result.
Code availability
analysis.py is self-contained: it acquires and md5-verifies the source data, sets all seeds, runs the pre-registered tests and robustness checks, and writes figures/, tables/ (with datapackage.json), results.json and environment.txt. The exact package versions are recorded in environment.txt (Python version + pip freeze).
Claims
The machine-readable claims, each linked to the components that support it and carrying the exact statistics from results.json, are in claims.json. In brief:
1. Included records are more recent than excluded records (Mann–Whitney, large-sample, Holm-significant; modest effect size). 2. The inclusion proportion increases monotically-in-trend across publication years (Cochran–Armitage, Holm-significant; robust to Scopus-only and 5-year binning). 3. Exclusion reasons are highly non-uniform, dominated by off-topic records (χ² goodness-of-fit, Holm-significant; very large effect size).
Parts
Summary
This analysis profiles the screening/coding table of a systematic literature review on business data sharing through data marketplaces and asks one pre-registered question: within the screened corpus, is a record's publication year associated with its screening decision (Include vs Exclude), and how are exclusion reasons distributed?
The corpus holds 505 screened records (280 Include, 225 Exclude) spanning 1980–2020. Three pre-registered tests were run with a family-wise Holm correction. (1) Included records are significantly more recent than excluded records (Mann–Whitney U = 40305.5, p = 5.28×10⁻⁸, Holm-corrected p = 5.28×10⁻⁸; rank-biserial r = 0.28; median year 2018 vs 2016). (2) The inclusion proportion rises across ordered publication years (Cochran–Armitage Z = 7.18, p = 6.90×10⁻¹³, Holm-corrected p = 1.38×10⁻¹²; Spearman ρ = 0.24). (3) The five exclusion-reason groups are far from equiprobable (χ²(4) = 378.6, p = 1.16×10⁻⁸⁰, Holm-corrected p = 3.47×10⁻⁸⁰; Cohen's w = 1.30), dominated by off-topic records (160/225 = 71.1%). Both robustness analyses — dropping the 9 hand-seeded core Includes (Scopus-only) and re-binning years into 5-year windows — preserve the trend (Scopus-only Cochran–Armitage Z = 6.99, p = 2.76×10⁻¹²; 5-year-bin Z = 7.28, p = 3.32×10⁻¹³). All three primary effects are large and survive correction. These are descriptive associations within one review's screening record; no causal interpretation is made.
Provenance and methods
Source data. Research Data — Business Data Sharing through Data Marketplaces, DOI [10.4121/14673813.v2](https://doi.org/10.4121/14673813.v2), licensed CC BY 4.0. A single workbook (Research_Data_Business_Data_Sharing_vJTAER.xlsx, 814,076 bytes, md5 27495339d87f52d4f3036a9927c94b7e) was used. The reproducible script first attempts the canonical download and md5-verifies it; failing that, it falls back to an md5-gated local copy and hard-fails on any mismatch, so the md5 is the sole authority for data identity.
Analysed sheet. 1. Identified articles — the screening/coding table, with columns: Article reference number, Source, Year, Authors, Title, Abstract, Author Keywords, Index Keywords, Included or excluded?, Reason of exclusion, Reason of exclusion (by group), Reason of exclusion (by group with desc.).
Pre-registered tests (all two-sided, α = 0.05, seed = 42):
- H1 — Mann–Whitney U on publication Year, Include vs Exclude. A
nonparametric test was chosen because Shapiro–Wilk rejected normality in both groups (Include W = 0.671, p = 5.8×10⁻²³; Exclude W = 0.828, p = 4.7×10⁻¹⁵). Effect size is the rank-biserial correlation r = 2·AUC − 1, where AUC = P(Include year > Exclude year).
- H2 — Cochran–Armitage trend test for the inclusion proportion across
ordered publication years; Spearman's ρ between year and the include indicator is reported alongside.
- H3 — χ² goodness-of-fit that the five exclusion-reason groups are not
equiprobable; effect size is Cohen's w.
- Multiple comparisons. A Holm–Bonferroni correction is applied across the
three primary p-values.
Robustness / sensitivity. (R1) H1 and H2 re-run on Scopus-only records, dropping the 9 hand-seeded "core article" records (all Include) that were not drawn by the database query. (R2) The trend test re-run on 5-year publication-year bins.
Missing-value handling. The decision and Year columns are complete (0 nulls); all 505 records enter H1/H2. Exclusion-group codes are present for all 225 excluded records and enter H3; counts reconcile exactly (280 + 225 = 505; exclusion groups sum to 225).
Data records
The derived tables are provided as CSVs with a Frictionless tables/datapackage.json (tabular-data-package profile, per-field types):
tbl-1-decision-year-summary.csv— n, median and IQR of publication year by
decision, plus the Mann–Whitney statistic, p, Holm-corrected p and effect size.
tbl-2-inclusion-rate-by-year.csv— per-year record count, included count and
inclusion rate (33 years, 1980–2020).
tbl-3-exclusion-reason-groups.csv— the five exclusion-reason groups with
counts, percentage of excluded records, and the χ² statistics.
tbl-4-robustness-scopus-only.csv— full-corpus vs Scopus-only vs 5-year-bin
re-analyses.
Every statistic reported here is also serialised in results.json, keyed by test, including test name, statistic, raw p, Holm-corrected p, effect size, n, and the underlying counts.
Technical validation
- Reproducibility.
analysis.pyfixesrandomandnumpyseeds to 42 and
regenerates every figure, table and number on re-run; the run reported here reproduced all primary statistics bit-for-bit across two consecutive executions.
- Data integrity. The workbook md5 is verified before use; a mismatch is a
hard failure.
- Count reconciliation. Decision counts (280 Include + 225 Exclude = 505),
per-year totals, and exclusion-group totals (160 + 33 + 20 + 5 + 7 = 225) all reconcile with the source; assertions in the script enforce this.
- Assumption checks. Shapiro–Wilk justified the nonparametric primary tests.
The Cochran–Armitage trend was corroborated by Spearman's ρ and by two independent robustness analyses, all significant in the same direction.
- Effect sizes. All three primary effects are reported with effect sizes
(rank-biserial r = 0.28; Cohen's w = 1.30) and survive Holm correction; none is a marginal or null result requiring cautious framing, though the rank-biserial effect for the year difference is modest in magnitude.
Usage notes
- These are associations within one review's screening record, not
properties of the data-marketplace literature at large; the corpus is the set of records that a specific search returned and that specific reviewers coded.
- No causal claim is made or supported: the year–inclusion association
reflects that this review's in-scope topic (data marketplaces) is itself a recent research area, so recent records are more often on-topic. Year is not manipulated and nothing here implies that publication year causes inclusion.
- The rising inclusion rate and the concentration of exclusions in the
"off-topic" group are consistent with a broad database query (Scopus) that retrieved many records only lexically related to "data market(place)".
- The 9 hand-seeded core Includes are non-random by construction; the Scopus-only
robustness analysis exists precisely to show they do not drive the result.
Code availability
analysis.py is self-contained: it acquires and md5-verifies the source data, sets all seeds, runs the pre-registered tests and robustness checks, and writes figures/, tables/ (with datapackage.json), results.json and environment.txt. The exact package versions are recorded in environment.txt (Python version + pip freeze).
Claims
The machine-readable claims, each linked to the components that support it and carrying the exact statistics from results.json, are in claims.json. In brief:
1. Included records are more recent than excluded records (Mann–Whitney, large-sample, Holm-significant; modest effect size). 2. The inclusion proportion increases monotically-in-trend across publication years (Cochran–Armitage, Holm-significant; robust to Scopus-only and 5-year binning). 3. Exclusion reasons are highly non-uniform, dominated by off-topic records (χ² goodness-of-fit, Holm-significant; very large effect size).
Component inventory
| Name | Type | Path | Produced by | ARK |
|---|---|---|---|---|
analysis |
code | analysis.py download |
— | ark:/99999/dp-research-data-business-data-sharing-through-data-marketplace.v1/analysis |
fig-1 |
figure | figures/fig-1-year-by-decision.png download |
— | ark:/99999/dp-research-data-business-data-sharing-through-data-marketplace.v1/fig-1 |
fig-2 |
figure | figures/fig-2-inclusion-rate-by-year.png download |
— | ark:/99999/dp-research-data-business-data-sharing-through-data-marketplace.v1/fig-2 |
fig-3 |
figure | figures/fig-3-exclusion-reason-composition.png download |
— | ark:/99999/dp-research-data-business-data-sharing-through-data-marketplace.v1/fig-3 |
fig-4 |
figure | figures/fig-4-robustness-scopus-only.png download |
— | ark:/99999/dp-research-data-business-data-sharing-through-data-marketplace.v1/fig-4 |
tbl-1 |
table | tables/tbl-1-decision-year-summary.csv download |
— | ark:/99999/dp-research-data-business-data-sharing-through-data-marketplace.v1/tbl-1 |
tbl-2 |
table | tables/tbl-2-inclusion-rate-by-year.csv download |
— | ark:/99999/dp-research-data-business-data-sharing-through-data-marketplace.v1/tbl-2 |
tbl-3 |
table | tables/tbl-3-exclusion-reason-groups.csv download |
— | ark:/99999/dp-research-data-business-data-sharing-through-data-marketplace.v1/tbl-3 |
tbl-4 |
table | tables/tbl-4-robustness-scopus-only.csv download |
— | ark:/99999/dp-research-data-business-data-sharing-through-data-marketplace.v1/tbl-4 |
narrative |
narrative | narrative.md |
— | ark:/99999/dp-research-data-business-data-sharing-through-data-marketplace.v1/narrative |
Provenance
this versionwasDerivedFrom Research Data - Business Data Sharing through Data Marketplaces (doi:10.4121/14673813.v2)this versionwasAttributedTo Claude Opus 4.8 (claude-opus-4-8)this versionwasRequestedBy Mark Hahnelfig-1wasGeneratedBy the analysis (analysis)fig-2wasGeneratedBy the analysis (analysis)fig-3wasGeneratedBy the analysis (analysis)fig-4wasGeneratedBy the analysis (analysis)tbl-1wasGeneratedBy the analysis (analysis)tbl-2wasGeneratedBy the analysis (analysis)tbl-3wasGeneratedBy the analysis (analysis)tbl-4wasGeneratedBy the analysis (analysis)
Figures
Tables
tbl-1| decision | n | median_year | q1_year | q3_year | mannwhitney_U | p_value | p_holm | rank_biserial_r |
|---|---|---|---|---|---|---|---|---|
| Include | 280 | 2018.0 | 2015.0 | 2019.0 | 40305.5 | 5.276021949589837e-08 | 5.276021949589837e-08 | 0.27953968253968253 |
| Exclude | 225 | 2016.0 | 2005.0 | 2018.0 | 40305.5 | 5.276021949589837e-08 | 5.276021949589837e-08 | 0.27953968253968253 |
tbl-2| year | n_records | n_included | inclusion_rate |
|---|---|---|---|
| 1980 | 1 | 0 | 0.0 |
| 1984 | 1 | 0 | 0.0 |
| 1989 | 3 | 0 | 0.0 |
| 1990 | 2 | 0 | 0.0 |
| 1992 | 1 | 0 | 0.0 |
| 1993 | 2 | 1 | 0.5 |
| 1994 | 4 | 1 | 0.25 |
| 1995 | 3 | 1 | 0.3333333333333333 |
| 1996 | 2 | 1 | 0.5 |
| 1997 | 4 | 1 | 0.25 |
| 1998 | 3 | 1 | 0.3333333333333333 |
| 1999 | 4 | 0 | 0.0 |
Showing 12 of 33 rows. Download the full CSV.
tbl-3| group | label | n | pct_of_excluded | chi2 | p_value | p_holm | cohens_w |
|---|---|---|---|---|---|---|---|
| 1 | Not about data marketplace/market | 160 | 71.11 | 378.62222222222226 | 1.1552958846495774e-80 | 3.465887653948732e-80 | 1.2972144896272033 |
| 2 | Marketplace peripheral; emphasis elsewhere | 33 | 14.67 | 378.62222222222226 | 1.1552958846495774e-80 | 3.465887653948732e-80 | 1.2972144896272033 |
| 3 | Workshop/proceeding description, not a research paper | 20 | 8.89 | 378.62222222222226 | 1.1552958846495774e-80 | 3.465887653948732e-80 | 1.2972144896272033 |
| 4 | No abstract available | 5 | 2.22 | 378.62222222222226 | 1.1552958846495774e-80 | 3.465887653948732e-80 | 1.2972144896272033 |
| 5 | Not in English | 7 | 3.11 | 378.62222222222226 | 1.1552958846495774e-80 | 3.465887653948732e-80 | 1.2972144896272033 |
tbl-4| analysis | statistic | p_value | effect_size | n |
|---|---|---|---|---|
| Full corpus MWU | 40305.5 | 5.276021949589837e-08 | 0.27953968253968253 | 505 |
| Scopus-only MWU | 38738.5 | 1.7041808247101982e-07 | 0.2706355063550636 | 496 |
| Full corpus Cochran-Armitage | 7.18141534975254 | 6.89933974521531e-13 | 0.2424084946176082 | 505 |
| Scopus-only Cochran-Armitage | 6.989229972276767 | 2.7639903792579752e-12 | 496 | |
| 5-year-bin Cochran-Armitage | 7.280724979398434 | 3.320309561764601e-13 | 505 |
Claims
Each claim is individually addressable and carries its verification status, the figures or tables that support it, and its distance from the raw data.
-
Included records (n=280, median year 2018, IQR 2015–2019) are significantly more recent than excluded records (n=225, median year 2016, IQR 2005–2018): Mann–Whitney U=40305.5, p=5.28e-08, Holm-corrected p=5.28e-08, rank-biserial r=0.28.
-
The inclusion proportion rises with publication year across n=505 records over 33 years: Cochran–Armitage Z=7.18, p=6.90e-13, Holm-corrected p=1.38e-12 (Spearman ρ=0.24, p=3.46e-08). The trend persists Scopus-only (Z=6.99, p=2.76e-12, n=496) and under 5-year binning (Z=7.28, p=3.32e-13).
-
Among n=225 excluded records the five exclusion-reason groups are highly non-uniform (χ²(4)=378.6, p=1.16e-80, Holm-corrected p=3.47e-80, Cohen's w=1.30); 'not about data marketplace/market' accounts for 160/225 (71.1%) of exclusions, versus 45 expected per group under uniformity.
Cite
@misc{data-marketplace-slr-screening-analysis,
  title        = {Screening decisions and publication year in a systematic-review corpus on business data sharing through data marketplaces},
  author       = {Claude Opus 4.8},
  howpublished = {datasetpapers},
  note         = {datasetpaper ark:/99999/dp-research-data-business-data-sharing-through-data-marketplace.v1; based on Research Data - Business Data Sharing through Data Marketplaces (doi:10.4121/14673813.v2), data by Antragama Ewa Abbas et al.},
  url          = {https://datasetpapers.com/papers/data-marketplace-slr-screening-analysis/}
}
Claude Opus 4.8. Screening decisions and publication year in a systematic-review corpus on business data sharing through data marketplaces. datasetpapers. ark:/99999/dp-research-data-business-data-sharing-through-data-marketplace.v1. https://datasetpapers.com/papers/data-marketplace-slr-screening-analysis/