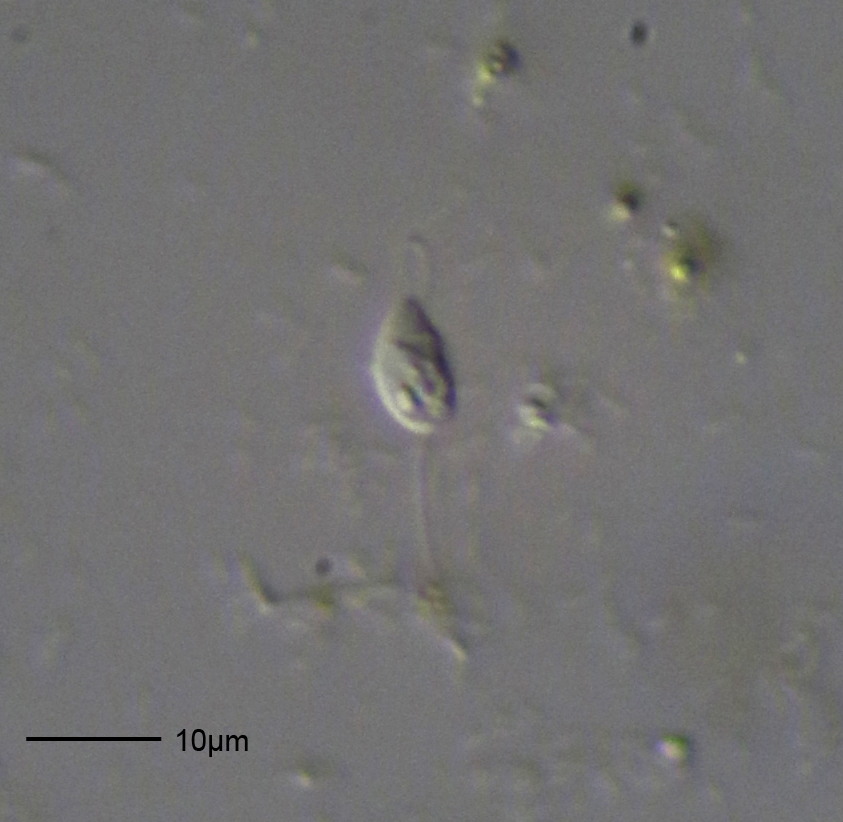
The Reference Sits Alone
Eight Bodo genomes went into this comparison — the existing Bodo saltans reference genome, plus seven single cells sequenced individually from cells fished one at a time out of a UK river. Compared purely on which protein-domain families (PFAM domains) they carry, and how often, the seven single cells sit closer to each other than any of them sits to the reference: the average distance between two single cells is 0.1316, versus 0.1791 from a single cell to the reference — 36% larger. A statistical test built for exactly this kind of comparison confirms it is not noise (Mann-Whitney p = 0.002363).
Rank all eight genomes by how far, on average, each sits from the other seven, and the reference comes out alone in first place at 0.1791 — clearly ahead of the most divergent single cell, F10, at 0.1667. It is not that all eight genomes are scattered evenly; it is that seven of them cluster in a comparatively narrow band from 0.1244 to 0.1667, and the eighth — the reference genome every future Bodo genome gets compared against — sits outside it.
Bodo saltans was the first member of its genus to get a published genome, back in 2008, which is the only reason it plays “the reference” here rather than any of the freshly sequenced cells. This reanalysis asks a pointed question of that historical accident: does the reference genome actually look, functionally, like a typical member of the genus it represents — or does it stand apart from cells sequenced almost two decades later?
Notice what kind of test that Mann-Whitney comparison had to be. With eight genomes split into a single reference and seven single cells, the field's standard way of testing whether two groups differ — a permutation-based group test called PERMANOVA — simply does not apply: a group of one genome has no internal spread to test against. So this comparison is built from the seven reference-to-cell distances tested directly against the twenty-one within-cell distances, the methodologically appropriate substitute when one side of the comparison is a singleton.
Mean Bray-Curtis distance from each genome to the other seven. Bsal (orange) is the reference genome; the dashed line marks the mean distance between two single cells (0.1316).
Eight tones, ascending pitch = ascending distance from the pack. The reference genome's note is held longer and layered an octave up — not just the highest note, a different kind of note. Synthesized in-browser; no file to load.
One River, Seven Cells, No Two Alike
The seven single cells behind this comparison were not cultured, pooled, or averaged. Researchers at the Earlham Institute and the University of Oxford sorted individual, uncultured Bodo cells one at a time out of a surface-water sample from the River Leam in Royal Leamington Spa, UK, taken in August 2022, then sequenced and assembled a genome from each cell on its own. Seven of those attempts produced a usable genome. That per-cell design is the entire reason any of this diversity is visible at all — a bulk, pooled sample would have blended all seven genomes into one averaged signal before anyone got the chance to compare them.
The source study's headline result is a mismatch: the standard genetic barcode long used to classify Bodo — a short stretch of ribosomal RNA — reads these seven cells as nearly identical to each other. But at the level of the whole genome, they sort cleanly into three distinct clades, and the authors concluded that the barcode gene is simply not sensitive enough to see species-level divergence in this genus. That gap between “the marker gene says uniform” and “the genome says structured” is the direct motivation for asking the same question yet again, through a third lens entirely: not sequence identity, not a barcode gene, but which protein-building-block domains each genome's proteins are actually made of.
Approximate collection site — the source study does not publish an exact sampling coordinate along the river, so this marks the town of Royal Leamington Spa, UK, on the River Leam.
Two Domains Do Most of the Work
Averaged across all 2,938 PFAM domains, the gap between the reference and the single cells has to come from somewhere specific. Ranking every domain by how differently it is represented in Bsal versus the mean single cell finds two domains doing most of the work in one direction: a leucine-rich repeat domain and an ankyrin-repeat domain are both more common in the reference. But the two next-largest gaps run the other way, and they are the more striking pair — a receptor-like signalling domain (PF07699, “putative ephrin-receptor like”) makes up 0.985% of the average single cell's domain content but only 0.009% of the reference's, effectively absent from it; a tetratricopeptide-repeat domain (PF13424) shows the identical pattern, 0.795% in the cells against 0.090% in the reference.
PFAM domains are curated, well-defined building blocks of protein function — counting how often each one shows up in a genome, then normalising for genome size, produces a coarse but genuinely comparable “functional fingerprint” for genomes that were assembled independently, by different pipelines, to different levels of completeness. That is exactly why this reanalysis chose domain content over gene counts or the source paper's barcode gene: a handful of a few thousand domain families shifting together in relative abundance is a harder pattern to produce by assembly noise alone than a single marker gene reading uniform by chance.
| Domain ⇅ | Description | Bsal % ⇅ | Cell mean % ⇅ | Difference ⇅ |
|---|
Top 15 PFAM domains by absolute divergence between Bsal and the mean single cell (of 2,938 total). Click a column header to re-sort; PF07699 and PF13424 stay highlighted regardless of order.
Which Ruler You Use Changes the Verdict
Run the identical comparison a second time using cosine distance instead of Bray-Curtis, and the result does not just lose significance — it flips. Under cosine distance the mean cell-to-reference distance (0.0742) is actually smaller than the mean within-cell distance (0.0830), the opposite ranking from Bray-Curtis, and the corresponding test is not significant (p = 0.1606).
That is not a contradiction; it is two metrics answering two different questions about the same numbers. Bray-Curtis weighs differences in how abundant the common, dominant domains are; cosine distance measures only the “shape” of a domain profile and ignores overall magnitude. A genome pair can look meaningfully separated when a handful of abundant domains are shifting in relative weight — which is what Bray-Curtis is built to detect — while looking statistically indistinguishable when only the profile's overall direction is considered, which is all cosine distance sees.
The separation itself, though, is not an artifact of which significance test was used to read the Bray-Curtis numbers. An independent 100,000-shuffle permutation test — reshuffling which of the 28 pairwise distances get labelled “cell-to-reference,” with no use of any parametric test — finds the observed gap or larger in only 72 shuffles out of 100,000, for p = 0.00072. The Bray-Curtis result holds up under a completely different statistical method; it is the choice of distance metric, not the choice of significance test, that this finding is sensitive to.
Same comparison, two metrics. Under Bray-Curtis the cell-to-reference bar (orange) is taller than within-cell (grey); under cosine, that ordering flips.
A Second, Independent Test Finds the Same Three Groups
Set the reference aside and cluster the seven single cells purely by their PFAM Bray-Curtis distances, cutting the resulting dendrogram into three groups. The result, member for member, is {A8, A10}, {B7, F10}, and {B2, G10, H10} — exactly the three clades the source paper defined using a completely different kind of data, whole-genome sequence identity. The two partitions are not merely similar; they are identical.
That agreement is not just categorical. Restricting to the seven single cells, the mean PFAM Bray-Curtis distance between two genomes in the same clade is 0.0908; between two genomes in different clades it is 0.1443 — 1.59 times larger. The same three-way structure the source paper found in DNA sequence identity shows up as a graded, not just binary, effect in functional domain content: cells from different clades are measurably further apart, not merely sorted into different labelled boxes.
This was not a foregone conclusion. Sequence identity and functional domain composition are, in principle, independent signals that could easily have disagreed — two genomes can share very similar DNA while differing in which functional machinery they actually express, or vice versa. Recovering the identical three-way split through an entirely different feature set is corroborating evidence that this structure reflects real underlying biology, not an artifact of whichever single method the original authors happened to use first.
(this analysis)
(whole-genome sequence identity)
Ruling Out the Boring Explanation
Before trusting any of this, it is worth asking whether the reference genome is the outlier simply because it has more stuff in it. Raw PFAM-domain hit counts range from 8,739 (F10) to 11,146 (Bsal) across the eight genomes — a 1.28x spread — and Bsal does happen to have the highest count of all eight.
Directly testing that: the correlation between a genome's total domain-hit count and its mean distance to the other seven is weak and not significant (Spearman rho = -0.262, p = 0.531, n = 8) — and if anything runs slightly in the opposite direction a pure annotation-volume artifact would produce. Having more annotated domains does not predict being functionally more distant from the rest. The reference's outlier status in the opening section is not explained away by this obvious confound.
Total annotated PFAM-domain hits vs. mean distance to other genomes. Bsal (orange) is highest on distance but not an outlier on domain count — the near-flat trend line shows no real relationship (rho = -0.262, p = 0.531).
What the Reference Genome Isn't Telling Us
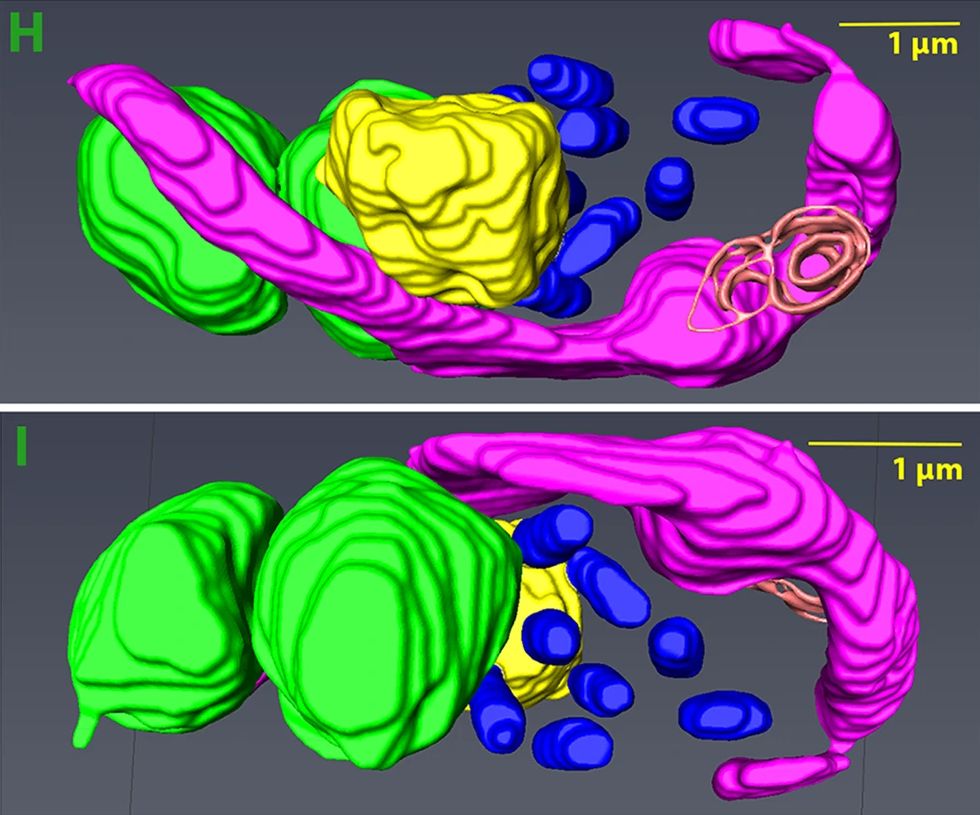
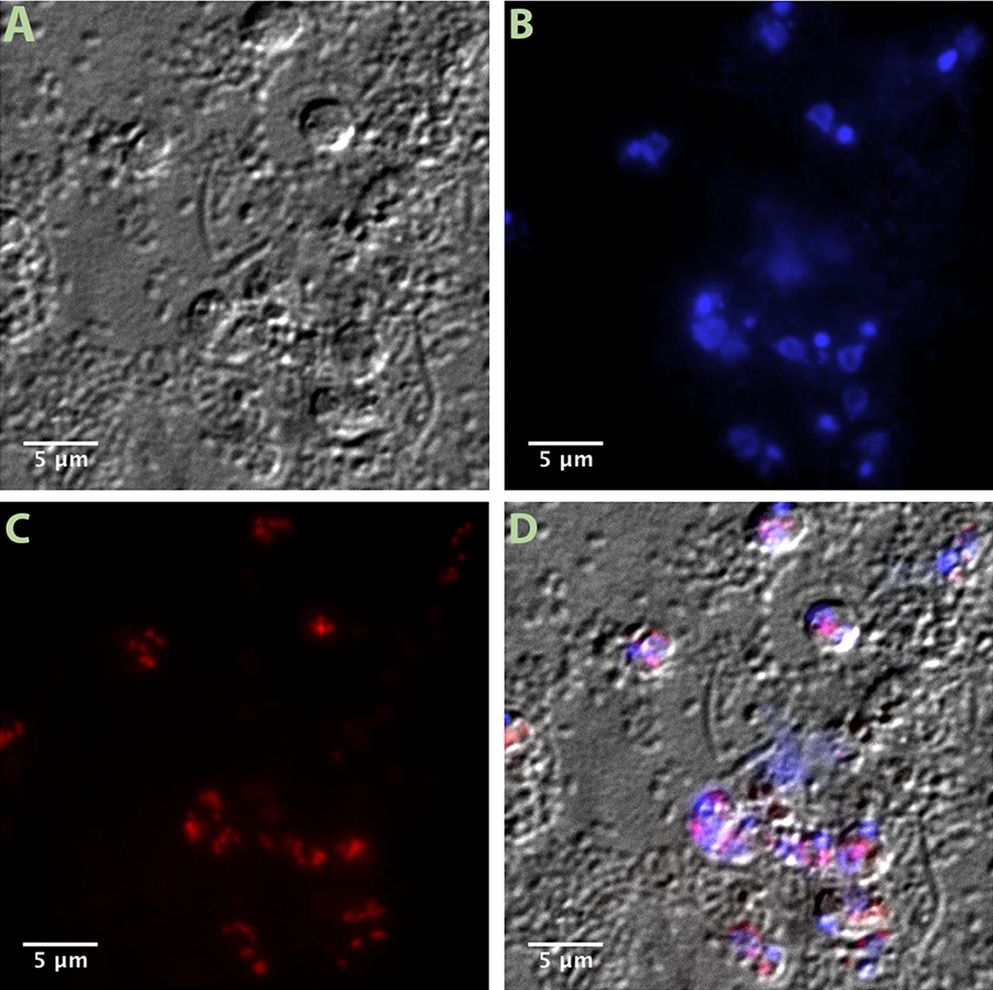
There is one thing about the reference genome that this reanalysis cannot test but cannot ignore either: Bodo saltans, uniquely among the eight genomes compared here, is known to depend on a bacterial endosymbiont that keeps it alive through what looks like chemical addiction rather than nutrition — a toxin-antitoxin system that kills the host cell if the bacterium is removed. The PFAM counts in this comparison come only from the flagellate's own nuclear genome, not the bacterium's, so this cannot explain the divergence directly. But it is a real, documented asymmetry between the reference and the seven cells that has nothing to do with genome assembly quality, and no analysis of domain content alone can rule it in or out.
This is one of at least two independent questions asked of the same underlying dataset. A separate reanalysis of the same source study's supplementary files asked whether the bacterial endosymbiont itself is metabolically reduced relative to its host — and found only a modest, statistically inconclusive asymmetry. Read together, the two analyses are honest in the same way: real, directionally consistent signal, reported as partial and metric- or method-dependent rather than oversold as a settled discovery.
The generalizable lesson here reaches past one genus of pond-water flagellate. Any comparative-genomics study built around a lone historical reference genome and a handful of newly sequenced individuals — an increasingly routine design as single-cell sequencing matures — will eventually face this exact pair of problems: a standard group test that doesn't apply to a group of one, and a result that may or may not survive a change of distance metric. Testing distances directly, checking a second metric, and saying so plainly when they disagree is not a weaker way to do the analysis. It is what an honest answer to a small-sample question looks like.
References & Sources
- Warring, S.D. et al. Single-cell sequencing of Bodo spp. flagellates and their bacterial endosymbionts. Figshare, 10.6084/m9.figshare.31362613 (CC BY 4.0). Supplementary File 9 ("PFAMs counts", "PFAMs PCA loadings").
- This object:
examples/bodo-endosymbionts/armB-round2— manifest, claims, verification record and original analysis2.py/narrative2.md/results2.json. - Analysis code for this reanalysis:
code/_common.py,code/01_load_and_profile.py–code/05_robustness_checks.py(all scripts fetch Supplementary File 9 directly from Figshare and verify its md5 before use).
- Warring, S.D. et al. Single-cell sequencing reveals unexpected genetic diversity among Bodo spp. flagellates and their bacterial endosymbionts. Microbial Genomics. PMC12999062.
- Midha, S., Rigden, D.J., Siozios, S., Hurst, G.D.D. & Jackson, A.P. (2021). Bodo saltans (Kinetoplastida) is dependent on a novel Paracaedibacter-like endosymbiont that possesses multiple putative toxin-antitoxin systems. The ISME Journal 15, 1680–1694. PMC8163844.
- Insights into the genome sequence of a free-living Kinetoplastid: Bodo saltans (Kinetoplastida: Euglenozoa). BMC Genomics. 10.1186/1471-2164-9-594.
- The Pfam protein families database: embracing AI/ML. PMC11701544.
- Bray-Curtis dissimilarity. Wikipedia. en.wikipedia.org/wiki/Bray-Curtis_dissimilarity.
- PERMANOVA-S: association test for microbial community composition that accommodates confounders and multiple distances. Bioinformatics. 32(17):2618.
- Bodo saltans – 400x, photo by Picturepest. Wikimedia Commons. CC BY 2.0.
- Fig. 2A–D and Fig. 2H–I, Midha et al. 2021 (above). Wikimedia Commons. CC BY-SA 4.0.
- Vega-Lite 5 / Vega-Embed 6 (charts), Leaflet 1.9 (map), native Web Audio API (sonification, no external library).